


 I'm not surprised at all to see Treasury bond yields rise in line with rising equity prices. They are both telling the same story: the economy is not collapsing; the economy is probably bottoming and may even be turning up somewhat; and deflation risk has all but disappeared. Neither market yet signals a recovery or rising inflation. Neither market is saying anything yet about the huge fiscal drag that Obama's policies represent (i.e., greater government intervention in the economy, increased regulatory burdens, increased tax burdens). And as I've said before, higher Treasury yields are far from being a threat to the economy; the yields on corporate bonds are still declining even as Treasury yields rise. The spread between the two leaves lots of room for these trends to continue.
Thursday, April 30, 2009
Treasury yields rise as equities rise
I'm not surprised at all to see Treasury bond yields rise in line with rising equity prices. They are both telling the same story: the economy is not collapsing; the economy is probably bottoming and may even be turning up somewhat; and deflation risk has all but disappeared. Neither market yet signals a recovery or rising inflation. Neither market is saying anything yet about the huge fiscal drag that Obama's policies represent (i.e., greater government intervention in the economy, increased regulatory burdens, increased tax burdens). And as I've said before, higher Treasury yields are far from being a threat to the economy; the yields on corporate bonds are still declining even as Treasury yields rise. The spread between the two leaves lots of room for these trends to continue.
Unemployment claims still suggest a bottoming (2)
 Weekly unemployment claims have not increased on balance for the past 12 weeks. It's looking more and more like the economy has hit bottom. The ISM manufacturing index to be released tomorrow could be very interesting, particularly if it shows continued improvement. I see the ongoing rise in equity prices and new highs in Treasury yields as a sign that the market is beginning to accept that we've seen the low point in this recession.
Wednesday, April 29, 2009
GDP surprise: inflation
 The economy contracted at a 6.1% annual pace in the first quarter, more than expected. The contraction was driven mainly by a huge inventory drawdown, which in turn was a reaction by business to the big slump in spending in the prior quarter. That will almost certainly turn around for the better in the current quarter, because spending is now growing again—real consumer spending rose at a 2.2% rate in the first quarter, and all the green shoots out there confirm that activity is bouncing in many areas of the economy.
The big news for me, however, was the 2.8% annualized rise in the GDP deflator, which is the broadest gauge of inflation. The chart above shows the year over year change in the deflator, and as you can see, there's not a lot going on, with inflation today about where it has been on average since the early 1990s. This is one of those "dogs that didn't bark," because conventional wisdom says that the huge (6.2% annualized) contraction in GDP over the past six months should have produced at least a little bit of deflation. That inflation is instead still alive and well is big news, because it says the conventional view of inflation is wrong. Inflation is not, as most people think, a function of the strength of the economy, but rather, as Milton Friedman says, a monetary phenomenon. Money has not been tight enough in recent years to bring inflation down. Since monetary policy is now quite accommodative, we should expect to see inflation drifting higher over the course of the year. This runs counter to what the market and the Fed are expecting, and that could easily overshadow the economy's likely recovery.
TIPS still offer good protection against higher-than-expected inflation, since they are priced to the assumption that inflation will be much lower than average over the next several years. Treasury bond yields, on the other hand, are going to be under tremendous pressure to rise.
Full disclosure: I am long TIP and TIPS, and long TBT at the time of this writing.
Tuesday, April 28, 2009
Photo Op Fiasco

Regarding the decision to send Air Force One on a publicity photo-shoot which ended up terrorizing New Yorkers and cost taxpayers more than $320,000, let me borrow from Milton Friedman to state the obvious: government bureaucrats that have the power to spend other people's money will, more often than not, make decisions that a person spending his own money would not. With Washington suddenly spending trillions of dollars more than ever before, we are quite likely to see many more such fiascos, and of far greater magnitude. Fasten your seatbelts, the Wild Obama Ride has just begun.
Being ever the optimist, I can only hope that a steady drumbeat of monumental fiascos will result in a decided shift in the political winds in favor of more limited government come November 2010.
Photo source
Richmond Fed survey bounces

It seems that all sorts of things are bouncing these days. Here's a chart of the Richmond Fed's survey of activity in the manufacturing sector in their district. While still in negative territory, it is a whole lot less negative than it was at the end of last year. Once, again, these bounces are telling us that the economy is not going down a black hole; we are not spiralling downward into a depression. Activity is stabilizing, and the economy is likely in a bottoming process.
Consumer confidence is bouncing

 Here are two different measures of consumer confidence. The first chart has data released today for April (from the Conference Board), while the other is from the U. of Michigan and was released a few days ago. Both show confidence bouncing in recent months from very low levels. This is not a lot to hang a recovery hat on, however. Confidence is typically a lagging indicator and tends to respond to other things going on, rather than being a driver of other things. This time it might be more important since it was a lack of confidence in banks and counterparties that helped precipitate the recent crisis. In any event, very low levels of confidence are typically characteristic of low points in economic activity, so these charts are telling us that we have a sufficient condition in place for a recovery, if not a necessary one.
Monday, April 27, 2009
Housing market green shoots (2)
 Bloomberg's index of the stock prices of major homebuilders is now up 75% from its recent lows (current: 120, low: 68). This is the biggest bounce in this index since the housing market started turning down almost four years ago, and it comes amidst a steady drumbeat of prognistications that a housing bottom won't occur until next year. There's a decent chance the market is telling us that we have already seen the bottom, or that we are very close to the bottom.
Swine flu fears overblown?
I am most certainly not an expert in flus or pandemics, but this article caught my attention: "Swine flu: nothing new." Excerpts:
HT: Mike Churchill
Swine flu has been hopping from pigs to humans for decades, sometimes causing disease, sometimes not. According to a study done by the Centers for Disease Control, 76% of swine exhibitors at a 1988 county fair had antibodies in their bloodstream indicating a prior swine flu infection, even though the exhibitors showed no signs of illness.
As of this writing, 80 people in Mexico have succumbed to swine flu. By comparison, the CDC estimates that 36,000 people in the United States die each year of influenza-related illnesses. If you’re not afraid of influenza, then you shouldn’t be afraid of the swine flu. Even in the event that someone gets infected with swine flu, we have medications with demonstrated effectiveness against the strain that’s currently active.
HT: Mike Churchill
Sunday, April 26, 2009
Deflation risk disappears
 This chart is Bloomberg's calculation of the 5-year forward expected inflation rate, 5 years from now (which is presumably the Fed's preferred measure of inflation expectations). As it shows, deflation risk was at its maximum right around the end of last year. Inflation expectations have since returned to where they were prior to the recent crisis. This can also be observed in the fact that 10-yr Treasury yields have risen by almost 100 bps since year-end, while 10-yr TIPS real yields have fallen by 50 bps. This reflects a strong shift in investors' preference for TIPS over Treasuries, which is consistent with a disappearance of deflation fears. If the line on this chart were to continue to rise, that would be an indication that the market is pricing in the risk of inflation rising to higher levels than we have seen in the past 10-15 years.
Of the two deadly risks that dominated the markets at the end of last year—depression and deflation—one has largely disappeared, and that is excellent news.
Friday, April 24, 2009
Equities are still extremely cheap

Equities are up almost 30% from their early-March lows, but the market is still extremely pessimistic. As this chart shows, the long-term trend rate of increase for S&P 500 index is roughly 8% per year. Relative to that trend, current prices are about as low today as they have been in the past 60 years.
Bond yields are bouncing--very bullish
 Yields on 30-year T-bonds today hit a new year-to-date high. At 3.88%, they are now 135 bps above their all-time lows of last December. Of all the things that are bouncing these days, rising yields on Treasury bonds are potentially the most significant. Investors drove yields down to incredibly low levels last December, when fear was at its peak and expectations of a global depression and deflation were rampant. To be happy with a 2.5% 30-year Treasury bond, you would have to believe that a) the economy was in for a massive contraction, b) inflation was going to be negative for many years, and c) depression plus deflation would wipe out a huge percentage of the corporate bonds then in existence.
Well, now it's looking like depression and deflation are not so likely after all. Investors are now less eager on the margin to buy Treasuries, even though the Fed has promised to buy lots of them in order to keep yields low and thus help stabilize the housing market. Rising 10-year yields haven't yet pushed mortgage rates up, but the spread between mortgage rates and 10-year Treasuries is unlikely to fall much more. Regardless, you can get 30-year fixed rate conforming loans for 4.8% now, and rates on 30-year jumbos have dropped to 6.2%, according BanxQuote. The spread between jumbo and conforming loans is still very high from an historical perspective, so it could fall a lot more. I don't think fixed rates on conforming loans are going to fall much more, if at all (this may be your last chance to lock in the lowest rates on conforming loans in your lifetime), but jumbo rates could still decline some more even if Treasury yields move higher.
Rising yields on Treasuries are unlikely to kill the housing market recovery anytime soon. Instead, they are an excellent sign that the outlook for the economy is improving. Green shoots are everywhere.
Capex not collapsing--very bullish
 The most important thing about a growing list of things that have bounced from year-end lows (e.g., commodity prices, industrial metals prices, oil prices, retail sales, container shipments, home builders' stock prices (+75%), junk bonds, emerging market debt, Apple stock, and now capital goods orders) is that economic activity is not going down a black hole. We are not caught up in a negative-feedback loop that will eventually turn into a depression. Even if all of these bounces only signify a stabilization of economic activity at a lower level, that is a far better outcome than the market is expecting. Depression and deflation fears still rule the roost. The bullish green shoots are becoming so numerous that we have most likely seen the bottom in economic activity. Going forward the issue will be the degree to which the economy recovers—how fast and how durable will the coming business cycle expansion be?
Thursday, April 23, 2009
Agency spread update

Progress towards tighter agency spreads has been slow, but it is still proceeding, from the looks of this chart. 5-year agency spreads peaked on Nov. 20th at 172 bps (intraday), and have since fallen to just under 60 bps. In a "normal" environment spreads should be 30 bps or less. Given that Fannie Mae is essentially in receivership, a spread of 60 bps is not all that bad, however. The U.S. government is essentially guaranteeing the debt, but who's to say the political winds won't shift? Investors willing to buy FNMA debentures for only 60 bps more in yield (2.5% vs. 1.9%) than Treasuries are showing a significant amount of faith in the government to honor its promises.
David vs. Goliath (2)
 As recently as a little over 9 years ago Microsoft had a market cap of $586 billion, while Apple's was a mere $17 billion. MSFT investors have since lost $421 billion, while AAPL investors have gained $95 billion. In my first post on this subject last October, I suggested AAPL could surpass MSFT's market cap within a few years. One reader said it would happen in less than a year. He has a good chance of being right.
Almost 90% of the people who visit this blog use Windows-based operating systems. 74% use Windows XP, 13% use Windows Vista, and 10% use Macs. Microsoft's only significant product introduction in recent years (Vista) will soon be eclipsed by the Mac OS, I predict. Given the relative failure of Vista, it's unlikely that many XP users will switch to the upcoming release of Vista 7 for at least a year or two. Macs will likely be the computer of choice for increasing numbers of people who want to switch from XP to a more modern operating system. Windows XP is almost 8 years old, while Apple's Mac OS X will see its sixth major upgrade this year, perhaps as early as June or July. If you haven't tried a Mac recently, you really should. And did I mention that there are no Mac viruses to worry about?
Full disclosure: I own several Macs and am long AAPL at the time of this writing.
Unemployment claims still suggest a bottoming
 First-time claims for unemployment rose a bit last week, but they haven't increased on balance now for the past two months. As this chart shows, the growth rate of claims appears to have peaked at a fairly high level. All of this continues to suggest, as I speculated last week, that the economy may be bottoming.
Wednesday, April 22, 2009
Our tax code must be scrapped
The excellent Richard Rahn writes in today's Washington Times about why any attempt to fix our current tax code will fail. It has become way too complex and places a disportionate burden on the most productive members of society. Excerpts:
You may have read that President Obama has just appointed former Federal Reserve Chairman Paul A. Volcker to head a panel to make recommendations for tax reform. Its mandate is to simplify the tax code, raise more revenue, close loopholes, reduce the so-called tax gap - and not raise taxes for American families making less than $250,000. The panel will fail!
It will fail because the complexity in the tax code cannot be lessened without a reduction in rates and the overall tax burden. It will fail, too, because the income-tax code and regulations contain many inconsistent and even contradictory explicit and implicit definitions of the word income, leaving taxpayers both confused and endlessly at risk legally.
... many of the tax- reform proposals being floated, such as higher marginal tax rates on small-business owners and even more restrictive depreciation limitations, are tax increases on the most productive and entrepreneurial people in society... .
The result of these reform efforts will be to force more companies to downsize or move to other countries in order to become internationally competitive. The people who will be most hurt by those tax attacks on business will be the workers who will lose their jobs or face more limited future job opportunities.
Knowledgeable people know the present income-tax system is irreparably broken and must be replaced with a more consumption-based tax system. More Band-Aids on the present income tax system will only result in more complexity, requiring even more police-state tactics in a futile attempt to enforce it.
Natural gas update
 Mark Perry notes today the big decline in natural gas prices in the past year. This chart puts the decline in a longer-term perspective than his chart. Prices have plunged, but they are still almost twice as high as they were in the 1990s. The incredible volatility of natural gas and oil prices in the past decade is truly staggering. This probably owes a lot to erratic monetary policy, which in turn has led to huge swings in the dollar's value over this same period. This is not good for producers or consumers in the long run.
TED spread update
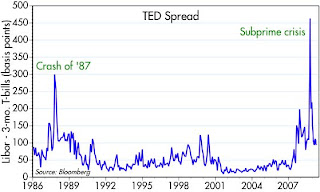 At the request of a loyal reader, here is an updated chart of the TED spread, which is very similar to the Libor/OIS spread he requested. I haven't posted this for awhile, mainly because it hasn't changed much so far this year, after collapsing in November and December. It's trading at about the same level today as it was in August '07. Still way above "normal," but well below the peak of late October '08.
It's probably too much to ask for this particular spread to fall back to normal levels at a time when the Fed is pursuing a quantitative easing policy. Fed policy has given us a short-term rate of almost zero, whereas 3-mo. Libor today is about 1.1%. The market is not expecting Libor to change materially until much later this year, when it is expected to be 1.4%. So we're at rock bottom, in a practical sense, for both of the spread components. I take that to be a positive, despite the fact that the spread is still unusually high.
Tuesday, April 21, 2009
US exports are rebounding--very bullish


US exports appear to be rebounding significantly after collapsing in the fourth quarter. The top chart shows the number of outbound containers from the Port of Los Angeles through March. A chart of outbound containers from the Port of Long Beach shows a similar rebound. The bottom chart shows US goods exports through February. Together, these two ports handle about 40% of U.S. container traffic, according to Bloomberg.
Given the lags involved with US trade statistics, it is not hard to believe that container shipment data are giving us an advance look at what should be a strong rebound in US goods exports to be released in coming months.
Trade collapsed in the final months of last year as consumers everywhere shut their pocketbooks, and as the banking crisis resulted in a virtual cessation of letters of credit, an essential ingredient in global trade. The international wheels of commerce now seem to be turning once again. This is strong evidence that the US economy is at the very least not collapsing, and is likely stabilizing. It's also good news for the global economy as well.
Inbound container shipments have also bounced, but not by as much as outbound traffic has. That suggests the US economy may be leading the way to recovery, just as we led the global economy down last year.
Mixed signals from Treasury are disturbing
The market swooned yesterday on rumors that Treasury would not allow big banks to repay their TARP money—it would instead force the conversion of the non-voting preferred stock that the government received in exchange for TARP injections into common stock with full voting rights. The forced conversion would apply to banks that fail the Treasury’s stress test, whose results are to be released early next month, presumably in order to assure the banks’ survival. Fear levels surged on other rumors that the vast majority of banks had already failed the stress test.
Stocks rose today after Treasury secretary Geithner said that “the vast majority” of the nation’s banks have sufficient capital to pass the test, even though Treasury yesterday inferred that they hadn’t yet conducted the tests. He later said that any bank not passing the test would have the “option” of deciding whether to convert preferred to common stock, or to raise additional capital by other means.
Are these people just making it up as they go along, floating trail balloons and then reversing themselves when the market reacts adversely? You have to wonder. Converting preferred stock into common stock doesn’t add a dime to the effective capital on a bank’s balance sheet, but it does dramatically dilute current shareholders, and it gives the government much more control over how the bank operates. As Larry Kudlow notes, it is simply a backdoor nationalization of the banks. Which banks would want to voluntarily choose such a course of action?
The potentially sinister motives that are hiding beneath the surface acquire credibility given the obvious intentions of the Obama administration to assert more and more centralized control over the economy (e.g., autos, banks, incomes, healthcare, energy, and most recently CO2). This helps explain why the stock market is having trouble following the corporate bond market higher.
Bonds beat stocks (4)
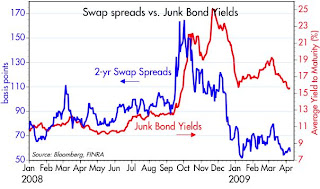
 This chart revisits the subject of earlier posts. It compares the yield on junk bonds (inverted) to the S&P 500 Index. The two markets are highly correlated, as you see in the chart, and this is typical over longer periods as well. The interesting thing to note is that the market for high-yield (junk) bonds has improved significantly so far this year, while stocks have languished.
Newer readers probably missed seeing my post in mid-November titled "Is this the end of the world or the opportunity of a lifetime?" In it I described key features of the Great Depression (e.g., real GDP declined by 26.5% over four years, and the peak of rate of defaults on all corporate bonds reached 14% in 1936), and compared it to the assumptions implicit in the pricing of equities and corporate bonds at the time (e.g., 24% of all corporate bonds would default within 5 years, and GDP would decline by almost twice as much as it did in the 30s). In other posts I have commented on the strong deflation expectations that were built into TIPS, and how these were questionable given that monetary policy in this crisis has been massively stimulative, while monetary policy was massively contractionary in the 1930s.
In short, in November our markets were priced for a future that would be much worse than the Great Depression. If the market was to be believed, then we were about to witness the end of the world as we know it. I thought that was pretty unreasonable, and so I thought that stocks and bonds were so incredibly cheap that it was hard to believe.
Now, six months later, the corporate bond market has repriced itself sharply higher (as yields and spreads have fallen), which means that the market has dramatically reassessed the likelihood of corporate defaults. This improvement was foreshadowed by a significant narrowing of swap spreads last year, another subject I have commented on many times, and it is supported by all the "green shoots" that we have seen in recent months which suggest that the economy is stabilizing. TIPS have also improved, as deflation expectations have receded. Equities, however, haven't improved at all on balance. What does this tell us?
A: The equity market is simply slow to catch on to the improving fundamentals.
B: Since the economy no longer looks to be in freefall, default rates are likely to be much lower than the market earlier feared, but the outlook for profits remains dismal, due to fears of higher tax burdens, increased government regulation, cap and trade, nationalization, etc.
C: Deflation risk has dropped significantly; this makes bond defaults much less likely, but does little to improve the outlook for profits.
D: All of the above.
I would choose D, for want of a better explanation. Regardless, we are still left with a puzzle. With so many things having improved, including corporate bond prices and TIPS prices, why aren't equities doing much better? Even if equities rallied another 30%, they would still reflect an economic outlook that could be described as no better than grim.
Full disclosure: I am long IVV, TIP, WIW, EMD, PAI and HYG at the time of this writing.
Monday, April 20, 2009
Obama setbacks are good news
The NY Times notes how some key proposals are hitting resistance in Congress.
In a separate article, the NYT reports that, contrary to his campaign promise, Obama does not plan to reopen negotiations on NAFTA. This may be the main positive outcome of the recent Latin summit conference in Trinidad. Anything that preserves free trade agreements is a good thing for all economies.
These are political "green shoots" since they reduce the policy risk facing the economy.
The administration’s central revenue proposal — limiting the value of affluent Americans’ itemized deductions, including the one for charitable giving — fell flat in Congress, leaving the White House, at least for now, without $318 billion that it wants to set aside to help cover uninsured Americans.Losing these sources of revenue means that it will be more difficult for Obama to push for a major expansion of government spending, and this in turn reduces the threat of significantly higher tax burdens in the future.
Lawmakers of both parties have warned against moving too quickly on a plan to auction carbon emission permits to produce more than $600 billion.
10 Senate Democrats joined Republicans this month in pushing to protect more wealthy American families from the reach of the federal estate tax.
In a separate article, the NYT reports that, contrary to his campaign promise, Obama does not plan to reopen negotiations on NAFTA. This may be the main positive outcome of the recent Latin summit conference in Trinidad. Anything that preserves free trade agreements is a good thing for all economies.
These are political "green shoots" since they reduce the policy risk facing the economy.
A better way to calm bank fears
Bank stocks are down sharply today on renewed fears of systemic instability, as bad news out today negates much of the good earnings news of the past few weeks. Turner Radio claims to have the results of the bank stress tests, and reports that they are dreaful (Treasury says they don't have stress test results yet). Bank of America announced today they set aside $6.4 billion to cover more bad loans.
Prof. Ricardo Caballero of MIT offers a simple solution. Instead of requiring banks to raise capital to meet the demands of extreme stress-test scenarios, the government should offer to sell banks insurance against these potential risks. That would go a long way to minimizing the negative feedback loop that has been at work in recent months. Excerpts:
HT: Don Luskin
Prof. Ricardo Caballero of MIT offers a simple solution. Instead of requiring banks to raise capital to meet the demands of extreme stress-test scenarios, the government should offer to sell banks insurance against these potential risks. That would go a long way to minimizing the negative feedback loop that has been at work in recent months. Excerpts:
A bank should be required to have as much capital as needed for the central scenario. If aggregate conditions are worse than expected, the government should cover the shortage of capital without equity compensation. If conditions are better than expected, the government should be paid a fee that compensates it for the insurance it provided. The government should charge fairly for this insurance, using the same probabilities it assigns to the different scenarios used in the stress tests. A weak bank needs to contract for more insurance than a strong bank.
It makes no sense that the aggregate risk remains on the most leveraged institutions of the system – which is precisely what got us into this mess. Instead, the way to solve this mismatch is to make fair insurance available to the banks rather than to force them to deleverage at great cost for the entire economy.
HT: Don Luskin
Bank lending still healthy

"Bank Lending Keeps Dropping" reads the headline of today's Wall Street Journal. "Lending at the biggest U.S. banks has fallen more sharply than realized, despite government efforts to pump billions of dollars into the financial sector." This chart is my answer to that. Total Bank Credit has declined 3.7% ($370 billion) from its peak of last October, but relative to long term trends, there is no problem with the amount of bank lending at all. If we have a problem, it is that politicians want to see "results" from their forced injection of TARP funds to major banks.
If bank lending really were in decline, we should see money supply measures also declining, but all measures of money are instead rising. As it is, the long-term growth rate of bank lending still far exceeds the roughly 6% long-term growth rate of both nominal GDP and the M2 money supply. And in any event, why should we expect bank lending to rise at a time when the economy is contracting and we know that deleveraging is the norm? You can't force banks to lend if there aren't willing borrowers.
As this chart suggests, any recent weakness in bank lending is likely a natural response to above-trend growth in bank lending in the runup to the currrent crisis, coupled with the weakness in the economy and the desire by many institutions to reduce their leverage.
Friday, April 17, 2009
The $7 trillion rally

The capitalization of global equity markets is up over $7 trillion from the lows of early March, but it's still down almost $30 trillion from the highs of late 2007. Is a new bull market underway? I see lots of bears warning that this is merely a bear-market rally, that stocks have yet to hit their lows, and there is no shortage pundits warning that the economy is in dreadful shape and a recovery is virtually impossible without more wealth destruction on a global scale.
In my view, the origins of this latest rally can be found in a variety of indicators: sharply lower swap and credit spreads; higher commodity prices; rising shipping rates; quantitative easing by the world's central banks; lower implied volatility in stock and bond options; a steep yield curve; surprisingly strong profits at banks and brokerage firms; a surge in home resale activity; historically low mortgage rates; a relaxation of mark-to-market rules; a decision by the Obama administration to back off from its headlong dash to implement cap-and-trade and universal healthcare; and push-back from the Senate on Obama's request to cut deductions on charitable contributions, to name just a few.
Note that I did not cite bailouts or TARP or PPIP or massive government spending stimulus or trillion-dollar deficits. I think the economy was always capable of recovering by itself, given time and some help from the Fed to accommodate a surge in the demand for money. If anything, I think the stimulus bill passed earlier this year will only retard the economy's recovery, since it boils down to government grabbing a huge amount of the private sector's money and spending it inefficiently; that money could have been put to use in a far more effective fashion by the private sector if policies had been geared to increasing the incentives to take risk (e.g., by lowering income taxes, and/or reducing or eliminating the corporate income tax) rather than redistributing income and force-feeding infrastructure projects.
Maybe we will see another selloff or two before equity prices march significantly higher, but that's probably irrelevant. What seems to be happening now is the beginnings of a virtuous cycle. Our dynamic economy has had plenty of time to adjust to new and painful realities; prices have adjusted massively so that markets are now clearing; confidence is slowly recovering; wealth is returning; cooler heads are prevailing. It all feeds on itself, resulting in a classic "melt-up" scenario.
In coming months we are likely to see a slowing in the pace of layoffs and a bottoming in inventories. Hiring should then resume, and by that time the recovery will be obvious to everyone and the equity market will be significantly higher, even if the outlook for growth isn't all that great and trillion-dollar-deficit storm clouds darken the economic horizon. In the meantime, expect to hear a steady drumbeat of pessimism.
Thursday, April 16, 2009
The crisis is passing (2)
 I last posted on this subject December 22nd. Here's an update on one of the charts I included in that post: the ratio of the VIX index to the yield on 10-year Treasuries. It's fallen by about 50%. Instead of signaling unbelievably dire conditions, as it was last November, it is now saying that we are just about getting down to the conditions that have prevailed during the worst of recent recessions. The market is effectively saying that instead of staring a record-breaking depression in the face, we are now looking at one of the worst recessions in recent times. That just about summarizes how I see the recent rally: it's not that things have turned positive, it's that things are not turning out to be so awfully horrible as people had been expecting. If the economy actually does take a turn for the better, there is a tremendous amount of upside left in this market.
Tea Party extremists

Here's a shot of two of the approximately 2,000 "right-wing extremists" that yesterday attended the Tea Party near Victoria Gardens. Anyone who thinks there's something sinister going on with this movement is really mistaken. If Nancy Pelosi had attended one of these rallies, she would never have dismissed them by saying "Those people want to return to the failed Bush policies." Most people were concerned about the massive growth of government, the bailouts, and what this means to tax burdens and our freedoms. We were very impressed by the whole thing, and went away from it thinking that this is just the beginning of something big.
UPDATE: (HT: Instapundit) I just can't help but post some comments from Rep. Jan Schakowsky (D-Ill.). The political class is so out of touch with what is happening on the ground that it's really pathetic. Contrast Schakowsky's words to the picture above:
The ‘tea parties’ being held today by groups of right-wing activists, and fueled by FOX News Channel, are an effort to mislead the public about the Obama economic plan that cuts taxes for 95 percent of Americans and creates 3.5 million jobs.
It’s despicable that right-wing Republicans would attempt to cheapen a significant, honorable moment of American history with a shameful political stunt. Not a single American household or business will be taxed at a higher rate this year. Made to look like a grassroots uprising, this is an Obama bashing party promoted by corporate interests, as well as Republican lobbyists and politicians.
UPDATE: Brian Wesbury has a nice essay on the economics behind the Tea Parties. They are basically a sign of a popular uprising against the growing size and cost of government.
Implied volatility is plunging
 I've highlighted the VIX index numerous times in the past, and it's noteworthy (and bullish) that it is now down to levels not seen since last September. There is a similar index for the bond market that is published by Merrill Lynch, called the MOVE index: "This is a yield curve weighted index of the normalized implied volatility on 1-month Treasury options. It is the weighted average of volatilities on the CT2, CT5, CT10 and CT30." It has also dropped significantly, and is now back down to the levels of last August, just before the big collapse in the market. Both of these indices are still above levels that one would consider "normal," but they are now far closer to normal than they are to levels corresponding to severe stress (note that the chart shows only month-end values for each index. The VIX peaked at 90 and on an intra-month, intra-day basis, traded well over 60 for most of October and November last year). Very bullish.
Industrial metals are bouncing
 I noted recently that copper prices were up about 70% from their lows of late last year. Copper has had one of the biggest bounces in commodity land, but the list of commodities that are rising in price has become impressive. This chart shows one of my favorite indicators, since it includes seven basic industrial metals prices. It is now up 24% from its December lows. Maybe it's just strong demand from China, but even so, it can't be dismissed; what's good for China is good for the global economy. Maybe it's the return of the speculators, but even if it is, it reflects a return of animal spirits and suggests that monetary policy is easy enough for people to start releveraging. Where there's smoke, there's fire.
Claims may signal recession end

The behavior of weekly unemployment claims seems to be signaling the end of the current recession. Claims were relatively flat at high levels for the past 6-7 weeks, and this week they dropped unexpectedly by a fairly large amount (610K instead of the expected 660K). This chart (its first appearance here) shows the rate of change, year over year, of the 4-week moving average of claims. That growth rate peaked 5 weeks ago, and has since dropped meaningfully. I would note that the reduction in claims was foreshadowed in my post last weekend. Obviously we'll have to see more follow-through to be sure, but this could well mark an inflection point in the economy, with the rate of decline now slowing instead of picking up speed. Similar behavior can be seen at the end of the last two recessions. The list of "green shoots" is getting longer.
Wednesday, April 15, 2009
Tea Party time
 I'm going to be attending my very first political demonstration this afternoon—a Tea Party! This is the sign I'm going to be carrying. Tax rates are simply way too high and climbing, and our tax code is nothing less than an abomination. We've got to do something about it, so it's time to hit the streets.
UPDATE: Cato has a variety of good articles on the flat tax concept.
Housing market "green shoots"

 After roughly 3 1/2 years of the worst housing market recession in U.S. history, we are beginning to see signs that the worst has passed. The National Assoc. of Realtors released their survey of home builders today (first chart) and it came in much higher than expected. Bloomberg's index of the stock prices of major home builders (second chart) today is 9% higher than it was six months ago. Construction activity has been so low for so long that most if not all of the excess inventory of homes has been worked off. Home prices have fallen in many areas by enough to stimulate demand. Spring is in the air in more ways than one.
Inflation is not dead
 The "headline" measure of the CPI fell 0.1% in March, leading to much hand-wringing in the press about the lingering threat of deflation given the very weak state of the economy. Take away the seasonal adjustment factor, however, and the CPI actually rose 0.24% in March. Take away food and energy, and prices rose 0.17%. The big collapse in energy prices is the main thing depressing headline measures of inflation, but going forward energy prices are going to be adding to inflation, not subtracting. In times like this it's best to focus on "core" measures of inflation (ex-food and energy). As this chart shows, core inflation has moderated a bit, but it is still running in a 2-3% range.
Deflation was a threat in 2002 and 2003, due to the Fed's extremely tight monetary policy in the late 1990s. That's not the case right now, nor will it be for at least the next few years. Inflation is a monetary phenomenon, not a function of whether the economy is growing above or below its "potential." I've been saying for awhile now that inflation was likely to come in higher than the market was expecting, and so far I've been right. The market, and the Fed, believe that the weak economy will generate deflationary pressures. I believe that it takes tight money to generate deflationary pressures, and I don't see signs that money is tight.
Because the market is still so concerned about deflation, TIPS are priced relatively cheap to Treasuries. If inflation continues to be 2-3%, TIPS will beat Treasuries over the next several years. If inflation moves higher, then TIPS will do very well; nominal Treasury yields would likely rise while TIPS real yields held relatively steady, and the total yield on TIPS would rise with rising inflation.
Full disclosure: I am long TIPS and TIP as of this writing.
Tuesday, April 14, 2009
Home price update (2)
 This chart uses the data contained in Shiller's book "Irrational Exuberance." (HT: Mark Sadowski) It is an index of inflation-adjusted home prices using his methodology, and the last datapoint that is available is for Q4/08. Considering the lags in the way the index is measured and published, I've estimated, extrapolating from recent monthly housing price data and inflation data, what the value of the index is likely to be for Q2/09. This in turn is probably a decent guess as to where housing prices are currently. If we consider the period from 1950-1999, when the index averaged 112, to be relatively "normal," then current prices are only about 7% above normal. But considering that mortgage rates are now at all-time lows, and housing affordability by other measures is at or close to record highs, I think it's safe to say that the housing bubble has fully deflated. Housing prices are at or very close to levels that are reasonable—if not attractive—from an historical perspective and from an affordability perspective.
If it is indeed the case that we have seen all or almost all of the decline in housing prices, then this has very bullish implications for the economy and for financial markets. If home prices do not fall further (and indeed start to bounce, as suggested by my Inland Empire anecdote post) then we should begin to see that delinquency and foreclosure rates stop rising. This in turn will put an effective limit on the losses of banks, and it will greatly enhance the transparency and pricing of all the exotic mortgage-backed securities out there, potentially resulting in improved pricing for securities that are now distressed given fears of an ongoing decline in housing prices. The good news would quickly cascade upwards as confidence in banks returned. This crisis started with the collapse in housing prices, and putting finis to that tragic episode is an indispensable part of an eventual recovery.
Retail sales are not collapsing
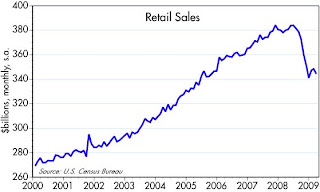
Retail sales unexpectedly fell in March, but the way I read this chart, sales in March were higher than they were in December. The market has been priced to the expectation that the economy is entering a depression of almost biblical proportions. The best news to date is that the economy is not falling off a cliff—it is likely stabilizing, and that is a much better outcome than the market has been expecting. Sensitive indicators, such as commodity prices, are actually rebounding after plunging in late 2008.
Monday, April 13, 2009
Oil factoids

 Since oil prices started rising in the early 1970s, the U.S. economy has responded by becoming increasingly more energy efficient. Our economy has grown over 160% since 1973, but our consumption of oil (first chart) has only risen a little over 12% during that same period. That translates into a 65% reduction in the amount of oil needed to produce a unit of GDP (second chart). These are remarkable statistics that are being neglected in the debate over our carbon emissions and our so-called dependence on foreign oil.
Inland Empire real estate anecdote
Real estate in the Inland Empire market (west of Los Angeles) appears to bouncing, after taking a severe beating. Saturday night I spoke with my nephew who does mortgages there. He told me about the recent foreclosure sale of a 2700 sq. ft. house, on a huge lot with a swimming pool, in Rancho Cucamonga. It was last bought in 2007 for $750K, and the owner upgraded all sorts of things. The bank foreclosed on the house and put it up for auction a week ago with a minimum bid of $385K. In five days the bank received almost 20 bids. The high bid was $450K, just ahead of a bid of $445K bid that included a $200K cash down payment. (He says there are lots of Orientals who are flooding the area with big cash bids.) The winning bidder plans to finance the purchase with an FHA loan: 30 years fixed at 5%, with a 3.5% down payment. He says the vast majority of loans he's making are FHA loans like this. About the only catch is that you have to have a clean credit record and a job. The program allows borrowers to have monthly payment obligations (auto, car, insurance, etc.) of up to 52% of gross income.
Saturday, April 11, 2009
Unintended consequences: $8 billion bonanza for paper mills
This article in The Nation describes a classic case of the unintended consequences that arise from government decisions to use tax credits to try to change the way markets work. I am reminded of how Argentina has repeatedly used devaluations to boost the competitiveness of its export industry, only to repeatedly discover that it doesn't work. Excerpts from the article:
Thanks to an obscure tax provision, the United States government stands to pay out as much as $8 billion this year to the ten largest paper companies. And get this: even though the money comes from a transportation bill whose manifest intent was to reduce dependence on fossil fuel, paper mills are adding diesel fuel to a process that requires none in order to qualify for the tax credit.
The origins of the credit are innocent enough. In 2005 Congress passed, and George W. Bush signed, the $244 billion transportation bill. It included a variety of tax credits for alternative fuels such as ethanol and biomass. But it also included a fifty-cent-a-gallon credit for the use of fuel mixtures that combined "alternative fuel" with a "taxable fuel" such as diesel or gasoline.
Enter the paper industry. Wood chips are cooked in a chemical solution to separate the cellulose fibers, which are used to make paper, from the other organic material in wood. The remaining liquid is called black liquor. Because it's so rich in carbon, black liquor is a good fuel; the kraft process uses the black liquor to produce the heat and energy necessary to transform pulp into paper. It's a neat, efficient process that's cost-effective without any government subsidy.
By adding diesel fuel to the black liquor, paper companies produce a mixture that qualifies for the mixed-fuel tax credit, allowing them to burn "black liquor into gold," as a JPMorgan report put it.
No one in Congress seems to have anticipated this creative maneuver. This past fall the Joint Committee on Taxation computed the cost of extending the tax credit for three months and projected it would cost a manageable $61 million. It now appears that the extension (which was passed as part of the TARP) could cost as much as $2 billion before the credits expire at the end of this calendar year.
In fact, the money to be gained from exploiting the tax credit so dwarfs the money to be made in making paper--IP lost $452 million in the fourth quarter of 2008 alone--that the ultimate result of the credit will likely be to push paper prices down as mills churn at full capacity in order to grab as much money from the IRS as it can.
Job losses may begin to slow
 The Conference Board keeps track of online job vacancies, and their March '09 report suggests that the slowdown in the decline in online ads (blue line) may herald a similar slowdown in the pace of job losses in coming months. It's another one of those "green shoots" that is consistent with a bottoming in the economy by mid-year.
Friday, April 10, 2009
Federal Budget update


 For the 12 months ending March 2009, the federal government's deficit was $1.096 trillion dollars. The age of trillion-dollar deficits has finally arrived.
As the top two charts show, the main reason for the ballooning deficit is spending. A good deal of the extra spending in the past six months has been due to things like TARP and Treasury purchases of assets (e.g., $119 billion of Freddie and Fannie debt in the past three months)—which are arguably one-time, emergency measures, and they aren't really spending so much as they are investments, because Treasury is likely to earn interest on this money unless the economy completely collapses. But the thing that will give us trillion-dollar deficits in the future is the huge planned increase in plain-vanilla government spending thanks to a) the recently-passed stimulus bill and b) Obama's ambitious spending plans.
The Obama administration is making some huge assumptions when it projects that spending will slow down sharply in years to come and revenues will pick up dramatically (third chart). But it's not hard to imagine that a lot of the "temporary" spending programs that will kick in over the next year or so will end up becoming permanent, and then continue growing—that's one unwritten rule of federal budgets. If Washington lacks spending discipline in the future, then spending could remain "stuck" in the range of 26-28% of GDP. Meanwhile, if higher tax rates and higher tax burdens end up slowing the economy's recovery and sapping its future strength, then tax revenues might well fail to exceed 19% of GDP. Thus we have a plausible scenario in which the deficit ranges from 7-9% of GDP for many years to come. The current 12-month deficit of $1.1 trillion is equal to 7.8% of GDP—and there you have the makings of deficits which could be $1.5 trillion per year five years from now.
In any event, we are now in uncharted (post-war) territory. A trillion-dollar deficit is not difficult to fund in today's climate, because the one asset the world is desperate to own is U.S. government debt. Treasury could probably sell significantly more than $1 trillion of debt this year without causing more than a modest ripple in interest rates. Moreover, Japan has run deficits of more than 10% of GDP for years without the sky falling. For now, the worst thing about all this is that the prospect of a significant and lasting increase in the deficit weighs heavily on the economy, because it means that at some point in the future, tax burdens will have to rise. If you know taxes will increase in the future, you reduce the expected after-tax return on capital today, and that means a lower price for our existing capital stock. That is basic financial math, and it goes a long way to explaining why, even after a 26% gain in the S&P 500 index in the past month, equities remain historically undervalued by just about any measure.
There are other potentially worse problems that loom, the principal one being that the Federal Reserve is now buying Treasury debt and other debt in quantity. Past deficits have never been a source of inflation, mainly because they were funded by the sale of debt, rather than by printing money. That no longer holds, unfortunately. The WSJ has put together a great chart which tracks the growth of the Fed's balance sheet.
I'm reminded of the four years I spent in Argentina, when inflation averaged over 7% per month. After returning to the states I spent a good deal of time in my first job studying the Argentine economy, and it was then that I saw how and why they had so much inflation. Since the Argentine government couldn't convince anyone to buy its debt, almost all of the deficit was financed by running the printing presses 24/7. I remember figuring out an equation which translated a given deficit into a future inflation rate, and my boss (John Rutledge) and I went to talk to the government in the mid-1980s to warn them that hyperinflation was on the way (and we were right).
I'm not saying that hyperinflation is in our future, because it is still possible for the Fed to withdraw all the money it is pumping into the economy in a timely fashion. For now the economy seems desperate for more money and more Treasury bonds, but that can and most likely will change once the economy shifts into recovery mode. It is then that the risk of rising inflation could become the dominant feature on the economic horizon. It seems to me that the balance of risks favors scenarios in which the Fed withdraws the money in an untimely fashion, thus fueling higher-than-expected inflation in the years to come.
Thursday, April 9, 2009
The Argentina rally
Can it be a coincidence that the rally that lifted the S&P 500 more than 30% started on the very day that I landed in Argentina? (March 10th) I'm going to have to go down there more often!
Fear subsides, prices rise (4)
 This chart helps explain the degree to which fear and uncertainty is driving the market. Leading up to the first major low in equity prices on Nov. 21st, the market was strongly and negatively correlated to the implied volatility of equity options (i.e., the Vix index, which is a good proxy for the level of fear, uncertainty and doubt). Since then, fear and uncertainty have subsided, but prices have not rebounded on balance. The rally of the past month has been accompanied by a reduction in fear and uncertainty, but while the Vix has returned to levels not seen since last September, the equity market remains generally depressed. But it's not just fear and uncertainty, it's also the knowledge that there are serious obstacles to recovery today that the market could only vaguely imagine six months ago.
Progress is progress, though, and with the decline in the Vix we have also seen a general decline in swap and credit spreads, a rise in commodity prices, a rise in shipping rates, a relatively stable dollar, an increase in market liquidity, a significant increase in home sales, and a bounce in retail sales; all signs that the economic fundamentals have improved. Improving fundamentals and less uncertainty/more confidence are exactly what is needed for the economy to find a bottom and stage a recovery.
Dr. Copper says the fever has broken
 Most commodity prices have bounced since the lows of late last year, but copper is now up 65% from its lows! Some of this may be profit taking by the shorts, but I have to believe copper is sending a very strong message regardless. That message is what best explains the equity market rally over the past month, and it's multifaceted. The economy is not going down a black hole; expansive monetary policy is gaining traction; demand is recovering; we are not in the grips of a deflationary depression; this is not the end of the world as we know it.
The economy still faces huge obstacles to a full recovery, no doubt about it. Fiscal policy is more likely to smother growth than to stimulate it; there are still many homes that will be foreclosed; the labor market has yet to find its footing (but I note that unemployment claims have been flat for the past weeks), etc. But the market was priced for a long downward spiral. If it can just manage to avoid going down a black hole, that becomes very bullish given the market's pervasive pessimism. This rally is a sign that the economic fever has broken; the patient may take a long time to fully recover, but he is not going to die. That's excellent news.
Equity Valuation


Equity valuation can be dressed up with lots of math, but in the end it is probably more art than science. Nobody has come up with a definitive method, and there are lots of variations on the theme. The first two charts are my contribution to the debate.
The first chart is simply the result of dividing the price of the S&P 500 index by per-share earnings, using data from Bloomberg. You might think this is fairly straightforward, but its not. A lively debate on the subject has been kicked off by a February 25 article by Jeremy Siegel in the WSJ, in which he argued that the S&P folks have been making a huge mistake with the methodology they use to calculate earnings on the S&P 500 index. He explains it all in greater and better detail in this article which came out yesterday. (HT: Greg Mankiw) The issue boils down to whether the earnings of all companies in the index should be added together to come up with a total, or whether they should be weighted by the weight of each stock in the index. Doing it the first way gives you a very high PE ratio, suggesting that stocks are not cheap at all. Doing it Siegel's way, which is what I show in the first chart, suggests that stocks are in fact quite cheap. Like Mankiw, I think Siegel is right. When you see reports that S&P earnings are extremely depressed, and PE ratios are extremely high, it's because huge losses being reported by a handful of companies whose market value is now extremely small are distorting the overall picture.
The second chart uses the price of the S&P 500 index, but instead of S&P earnings, it uses earnings as calculated in National Income and Products Accounts. NIPA earnings are adjusted for a variety of things, in an attempt to come up with "economic" profits that are not subject to the vagaries of things like goodwill writedowns. As a result, NIPA profits tend to be more stable over time, as seen in the following chart (and NIPA profits represent the profits of all companies, not just the top 500). Interestingly, both charts tell roughly the same story: stocks are cheap.
 To put profits in a different light, the next chart compares NIPA profits to nominal GDP, with the most recent data (only recently released) being for the fourth quarter of 2008. At the end of last year, corporate profits after tax were a little over 7% of GDP, above the 6% average of the past 50 years. If all you had to go by was this chart, you would be hard-pressed to explain why equity prices have dropped by almost 50% in the past 18 months, and why PE ratios are at the low end of their long-term range.
Wednesday, April 8, 2009
Swap spreads are still a good leading indicator
 I've been touting swap spreads as a good leading indicator of the health of the financial market for years. When swap spreads fell significantly last October, I took that as a sign that the fundamentals were beginning to improve, and that financial markets in general were going to be turning up. I first showcased this chart last November, arguing that junk bonds were a steal. And indeed, junk bonds have done quite well since and look to do even better in the future.
The extraordinarily high yields and spreads on corporate debt that we saw a few months ago were telling us that the market expected something like half of all the companies in the U.S. to go bankrupt within the next five years. Driving this extremely grim forecast was the market's belief that collapsing demand would give us years of deflating prices, and that the world economy would therefore spiral downwards into a black hole worse than what we saw in the Great Depression.
As it is turning out, the reality is proving to be much less grim than the expectations. Monetary policy is extremely easy, and it is gaining traction. Bailout efforts have been massive, costly, and probably ill-advised, but they have succeeded, apparently, in restoring some measure of liquidity and confidence to the credit markets. The market has had plenty of time to heal itself. Confidence is the key ingredient to an eventual recovery from this crisis, and it is slowly returning.
To hang out in cash and earn almost nothing, while junk bonds are yielding in the double digits, requires a profound degree of pessimism. One example of how pessimistic the pundits are can be found in a NY Times Op-Ed piece two days ago. Four out of five economists could not muster even an ounce of optimism, despite all the "green shoots" of recovery. Such overwhelming pessimism is an essential ingredient for a market rally such as we have witnessed over the past month.
Full disclosure: I am long EMD and HYG.
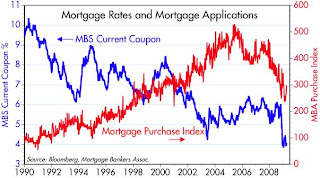
Mortgage refinancing and lending is strong
 I keep hearing politicians and government officials bemoaning the fact that "banks aren't lending" and the economy is foundering because financial markets are frozen. Hmm. These two charts suggest that business is essentially booming if you work for a bank or institution that still engages in mortgage lending. With the big decline in mortgage rates in the past six months, refinancing activity has surged to levels almost as high as the record-setting peak in the summer of 2003. Applications for new mortgage purchases aren't nearly as high today as they were at the peak of the housing boom in 2006, but they have jumped 25% since the end of February, and they are back to the levels we saw in 1999-2000.
To be sure, the boom in mortgage lending and refinancing is largely confined to conforming loans (up to $730K in high-cost areas). Those needing jumbo loans must pay about 1 1/2 points more, but even then, according to BanxQuote, the national average for 30-year fixed rate jumbo loans is 6.37%, which is not exactly usurious when viewed in an historical context.
Brazil is bouncing
 Measured in dollars, Brazil's stock market is up 57% from its lows of Nov. 21st, 2008, whereas the S&P 500 is up only 10%. Brazil's market had previously lost about 70% of its value, since Brazil was at the apex of the global financial storm: commodity prices had been crushed, the dollar was rebounding, and investors were unwinding carry trades. All of those pressures are being reduced now: the dollar today is about the same as it was in late November, commodity prices are generally higher, and investors and speculators have had plenty of time to unwind carry trades and deleverage. There is plenty of upside in emerging markets if the global economy simply avoids depression and deflation, and by the looks of things, a modest recovery appears to be getting underway.
Full disclosure: I am long shares of SLAFX and EMD.
Subscribe to:
Posts (Atom)