Saturday, February 27, 2010

The coming political tsunami


By the time the tsunami hit Hawaii today it was pretty tame. But there is a huge political tsunami that is headed to Washington, and it is expected to hit in early November of this year. This chart, which shows Obama's Approval Index hitting an all-time low for the second time, is the evidence for my claim.

The chart makes it clear that more and more people strongly disapprove with what Obama is doing, at the same time that fewer and fewer strong approve. Obama and the Dems seem to think the reason for this is that they haven't done enough to advance the liberal agenda, but for any objective observer, I think it's clear that they have tried to do way too much.

The sudden birth of the Tea Party movement about a year ago was like the first of a swarm of earthquakes that have since generated bigger and bigger aftershocks. The Massachusetts election of Scott Brown last month was not only a major aftershock, but it eclipsed all of the prior ones. Just two days ago was the healthcare reform summit, another major aftershock. (Don't miss Peggy Noonan's excellent description here.) The tsunami waves have been set in motion, and they are traveling all around the 50 states, gathering momentum and amplification as the errors of Washington collide with political topography of the country.

Are there enough Democrats really willing to sacrifice everything in order to engineer a government takeover of almost one-fifth of the economy? Rahming it through via reconciliation is surely a no-win situation. The public doesn't support the package at all, and any attempt to force it through, especially if more behind-the-scenes wheeling and dealing is necessary to accomplish it, will only sour the public even more. I don't see Nancy Pelosi getting the votes. And the harder she tries, the worse it's going to be. And even if the bill does somehow pass, it is so riddled with fatal flaws that it is unlikely to ever be implemented.

So my sense is that Democrats will be scurrying for high ground in the months to come, just as the residents of Hawaii evacuated the shoreline this morning in advance of the tsunami's arrival. Gridlock will be the likely result, and that's a very good thing at this point.

The true path to high ground lies in radically scaling back the ambitions of Washington lawmakers. Otherwise, they are going to be swamped. Mark Steyn has a good analogy for all this:

While Barack Obama was making his latest pitch for a brand new, even more unsustainable entitlement at the health care "summit," thousands of Greeks took to the streets to riot. An enterprising cable network might have shown the two scenes on a continuous split-screen - because they're part of the same story. It's just that Greece is a little further along in the plot: They're at the point where the canoe is about to plunge over the falls. America is further upstream and can still pull for shore, but has decided, instead, that what it needs to do is catch up with the Greek canoe.

Think of Greece as California: Every year an irresponsible and corrupt bureaucracy awards itself higher pay and better benefits paid for by an ever-shrinking wealth-generating class. In Greece, they've run out Greeks, so they'll stick it to the Germans... in America, Obama, Pelosi and Reid are saying we need to paddle faster to catch up with the Greeks and Germans. What could go wrong?

We need to stop the runaway growth of government, entitlement programs, wealth redistribution, transfer payments and taxes, and we need to send politicians to Washington who understand this. I think this can happen, and that's one reason why I remain optimistic. The coming political tsunami is going to wash away a lot of the deadwood and corruption in Washington, and it's going to leave in its place a new generation of politicians who understand that the best thing for the country is to just leave the people alone.

Friday, February 26, 2010

Existing home sales


Existing home sales have plunged in recent months, but mainly because of the anticipated expiration of the homebuyer tax credit in November, which caused many to accelerate their purchases into October. Now that it has been extended, the pace of sales has settled back down, and may be returning to "normal." I note that the inventory of homes for sale has declined by 27% since its peak, as shown in the next chart, while sales activity has been relatively stable. This doesn't look to me like a market that is collapsing or off balance. And with inventories down, there is room for the market to absorb new foreclosures.

Canadian banking system beats ours

Almost 200 U.S. banks have failed since early 2008, but not a single Canadian bank has. The delinquency rate last December for home mortgages in the U.S. was 9.47%, but only 0.45% in Canada. What explains this incredible difference? Read Mark Perry's fascinating article to find out, but here's a summary:

• Full recourse mortgages
• Shorter-term fixed rates
• Mortgage insurance
• No tax deductibility of mortgage interest
• Higher prepayment penalities
• No Community Reinvestment Act
• Much larger banks
• Less mortgage securitization

Canada has largely eschewed policies which encourage home ownership and insulate homeowners from the consequences of their purchase decision, yet Canada has a higher home ownership rate than we do. We could learn a lot of lessons from our northern neighbors when it comes to banking and home ownership.

UPDATE: I noted that an Australian pointed out many of these same issues way back in Oct. '08. The origins of our housing crisis have nothing to do with free markets; it's government intervention in free markets that screws things up.

Manufacturing V-shaped recovery continues


This is a chart of the Chicago Purchasing Manager's Index, whose February reading, released today, exceeded expectations (62.6 vs. 59.7). The Chicago index has traditionally been highly correlated (0.87) to the overall ISM index, which will be released Monday. That index, in turn, has done a pretty good job of tracking the quarterly growth of GDP, as shown in the next chart. What it all means is that the recovery in the manufacturing sector has been remarkably dynamic, and this strongly suggests that the economy will experience growth of at least 4% in the current quarter.

Thursday, February 25, 2010

Financial conditions -- another V-shaped recovery


I'm getting a lot of pushback of late for my unrelenting optimism in the face of some disappointing market stats and economic releases. So I thought it appropriate to review at least some of my reasons for thinking that things are indeed getting better despite the occasional setback.

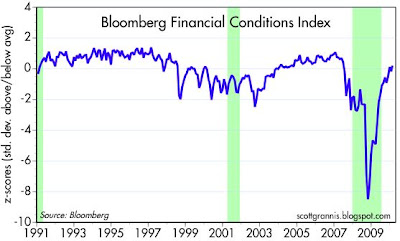
I last commented on this chart in early December. It's Bloomberg's index of financial conditions, a composite of key financial fundamentals such as credit spreads, implied volatility, interest rates, and P/E ratios. The y-axis of the chart is measured in z-scores: the number of standard deviations above and below the average of the 1992-June 2008 period.

The peak of the financial crisis in late 2008 was literally off the charts from an historical perspective, shown here as a 9 standard deviation event (the actual low for the index was -12.6, which occurred on Oct. 10 '08). This was a market that for all intents and purposes was priced to Armageddon: a deep depression accompanied by paralyzing deflation and lasting for years. In just over a year we now find ourselves back to something that resembles normalcy, and more than 9 months into a recovery.

What a difference a year makes! It's hard to underestimate the importance of this: the reality we are living today far surpasses even the most optimistic forecasts of a year ago.

Notwithstanding the power struggles in Washington which seem to have left us in legislative limbo (thank goodness for the respite), financial markets have undergone a significant healing process in the past year, and we have seen plenty of signs of recovery, this chart being an important one.

Meanwhile, I don't see any of the typical signs that presage economic downturns. Swap spreads have been trading at "normal" levels for months now, and credit spreads are significantly tighter and much more stable than they were a year ago. Very tight monetary policy has been the leading cause of every post-war recession, but we certainly don't have that problem today. All of the key measures of monetary conditions suggest monetary policy is accommodative: the yield curve is very steep, real yields are relatively low, the dollar is relatively weak, and gold prices are up hugely. If anything goes wrong in the near future, it will not be for a lack of money.

Fiscal policy has been turbulent this past year, but we have yet to see policies, such as a significant increase in tax burdens, a serious outbreak of trade wars, or a major increase in regulatory burdens, that have in the past contributed to a meaningful economic slowdown. There are of course concerns in all these areas, but if anything, the likelihood of a nasty turn in fiscal policy has decreased over the past year, thanks to very visible and growing opposition to the direction Obama has been trying to take us. Why else would Obama take such pains to emphasize that he is "an ardent believer in the free market?"

I have an enduring belief that when left largely alone and fed a diet of financial normalcy, the U.S. economy is quite capable of growing, even in the face of fiscal adversity.

As the chart above shows, financial markets have healed. Asset markets have healed as well, with home prices stabilizing and commodity prices recapturing much of their 2008 losses. We've got tens of millions of entrepreneurs out there, all of whom want to make more money than they made last year. We've got 130 million people working 5% more productively in the nine months ended last December. Corporate profits after tax likely rose over 20% last year. Business investment is up at a 15% since last April. U.S. corporations raised over $450 billion by selling new bonds in the past 12 months. The ISM manufacturing index has surged to levels that are fully consistent with 4+% growth. The stock market is up over 60% from its recent lows. Homebuilders' stocks are up fully 126% from their March lows, even though residential construction has collapsed to a mere 2.5% of GDP. Exports have jumped at a 27% annual rate since last April. Despite the Fed's massive liquidity injections, the dollar today is worth almost the same, relative to other major currencies, as in mid-2007, before the recent crisis was on anyone's radar screen.

The list of positives could go on, but suffice it to say that to be pessimistic today you have to ignore an awful lot of good news.

Outlook for mortgage rates


Calculated Risk today has a good post on the outlook for mortgage rates now that we are approaching the end of the Fed's MBS purchase plan, which is 96% complete. He concludes that "mortgage rates will rise 35 to 50 bps relative to the Ten Year when the Fed stops buying agency MBS at the end of March."

That's pretty much the same conclusion I've come to. I'll add some charts to the discussion which make the same point from a different approach.


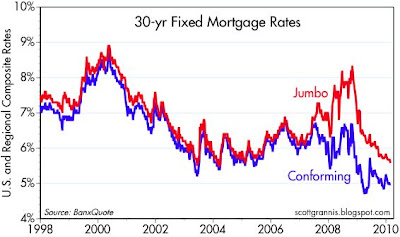
This chart shows the 26-year relationship between Fannie Mae collateral and 10-yr Treasury yields, with the spread on the bottom. Note that the spread has averaged about 125 bps, and currently stands at about 70. The spread has rarely traded at less than 100 bps, which suggests that Fed purchases may have caused spreads to tighten by 30-55 bps.


This next chart shows a more unconventional spread, comparing FNMA collateral to the 5-yr Treasury yield for the period that began with the Lehman collapse in 2008. Note that the Fed first started buying MBS in significant quantities around the middle of March '09. Prior to the start of its MBS purchases, the spread averaged about 240 bps for several months; subsequently it fell to a fairly stable 200 bps. This suggests that Fed purchases could account for a spread tightening of about 40 bps.

Thus we circle back to the conclusion that when the Fed ceases its MBS purchases at the end of March, we should expect mortgage yields to rise by roughly 30-50 bps relative to Treasury yields. Most of that rise could be absorbed by conforming mortgages, since the spread between jumbo and conforming loans is still quite wide by historical standards. But in any case, the likely rise in mortgage rates will still leave them quite low by historical standards (barring, of course, a major increase in 10-yr Treasury yields). Thus I don't see a big threat to the housing market looming.

The development that stands the biggest chance of causing a significant rise in mortgage rates is a big rise in Treasury yields. As I've pointed out before, however, a big rise in 10-yr Treasury yields is most likely to coincide with and signal a much stronger economic outlook. A stronger economy, in turn, would have the effect of offsetting (via rising incomes and greater optimism) most if not all of the rise in mortgage rates.

Healthcare reform

President Obama and Congressional bigwigs are talking at each other today on the subject of healthcare reform. Arnold Kling offers a good summary of why they are wasting their time:


There are two ways to approach reducing the use of high-cost, low-benefit procedures. You can have the government tell people what they can and cannot have. Or you can have individuals pay for a larger fraction of the medical procedures that they consume. It really comes down to those choices.

Advocating either one of those is political suicide, and talking about anything else is a waste of time. The Democrats will not advocate government rationing, and the Republicans will not advocate scrapping most of our current system of third-party payment in medicine. Instead, the summit, like the entire "health reform debate" this year, will be a waste of time.
On a more positive note, the WSJ today has a good article by Cogan, Hubbard and Kessler that lays out a simple and easy-to-implement plan that would go a long way toward improving our healthcare system. Here are the key points:


To bring down costs, we need to change the incentives that govern spending. Right now, $5 out of every $6 of health-care spending is paid for by someone other than the person receiving care—insurance companies, employers, or the government. Individuals are insulated from the reality of what their decisions cost. This breeds overutilization of low-value health care and runaway spending.
To reduce the growth of costs, individuals must take greater responsibility for their health care, and health insurers and health-care providers must face the competitive forces of the market. Three policy changes will go a long way to achieving these objectives: (1) eliminate the tax code's bias that favors health insurance over out-of-pocket spending; (2) remove state-government barriers to purchasing and providing health services; and (3) reform medical malpractice laws.

The tax code's favorable treatment of employer-sponsored health insurance over out-of-pocket health-care payments means that, for most families, buying health care through an employer is 30%-40% cheaper than buying it directly. The best way to address this clear bias is by making all health spending—including out-of-pocket payments, purchases of individual insurance, and purchases of COBRA coverage—tax-deductible.

There are two additional steps to reforming private insurance markets. First, individuals must be allowed to buy health insurance offered in states other than those in which they live. The current approach of state-by-state regulation has raised costs by reducing competition among insurance companies. It has also allowed state legislatures to impose insurance mandates that raise prices, while preventing residents from getting policies more suitable for their needs.

Second, reasonable caps on damages for pain and suffering need to be established in medical malpractice cases. Caps on these kind of damages reduce costs and decrease unnecessary, defensive medicine.

These three policies ... fundamentally change incentives among individuals, insurers, and providers to gradually slow the growth in costs by reducing inefficient demand without sacrificing quality and innovation. Instead of radically changing health care overnight, they take an incremental approach, respecting the tremendous uncertainty surrounding the effectiveness of different approaches to rein in costs.

Capital goods orders tick down but still strong


Durable goods orders jumped 3% in January, much more than expected. But if you subtract transportation orders, they fell more than expected. My favorite version of these numbers (non-defense, ex-aircraft orders) is shown in this chart, which I consider to be a proxy for business investment spending. While the January number was below expectations, the December number was upwardly revised by about $1 billion, so the net change was a small negative. In any event, this series is notorious for its month-to-month volatility. Abstracting from the monthly noise, business investment is up at an annualized rate of 15.5% since hitting a low last April. That's a strong rebound by any definition. Business investment like this will create a good base for future productivity gains and eventually a return to new hiring.

Weekly claims' progress derailed


The impressive decline in unemployment claims that began last April has been derailed. This may be a sign that the economy is turning south, but it may also be just one of those things that happen on the road to recovery. I note that similar setbacks occurred several times (and more severely) in the early years of the recoveries following the '90-91 recession and the '01 recession. The recent jump in claims may also be due to weather, and it seems likely that snowstorms in the East will contribute to a disappointing jobs number next week. I think you have to expect data to be volatile from time to time. It's much more likely that we are just seeing random noise here than that there is a fundamental change in the economy's direction afoot.

UPDATE: As an alert reader reminds me, non-seasonally adjusted claims have actually plunged from 800,000 during the week of Jan. 8th, to 452,000 in the most recent week. That the seasonally adjusted number has risen over this same period means that claims haven't fallen as much this year as they might normally be expected to. But it's possible, especially given the gyrations of the past few years, that the seasonal adjustment factors are off. This is a good reminder that you should always take statistics like this that are subject to seasonal adjustment with a grain of salt.

Tuesday, February 23, 2010

Gold and commodities


This chart shows the relation between gold prices and the spot prices of non-energy industrial commodities (burlap, butter, cocoa beans, copper scrap, corn, cotton, hides, hogs, lard, lead scrap, print cloth, rosin, rubber, soybean oil, steel scrap, steers, sugar, tallow, tin, wheat, wool tops, zinc). The correlation between the two is pretty impressive, and it's also noteworthy that gold prices tend to lead commodity prices by as much as a year or two.

The huge current gap between gold and commodity prices is just screaming to be addressed. Are we on the cusp of a major upturn in commodity prices? What is driving these prices higher: inflationary monetary policy or stronger global growth, or both? I don't have solid answers, but the surge in gold prices in recent years, coming at a time when virtually all major central banks are pursuing accommodative money policy, suggests to me that the monetary explanation for higher commodity prices is the dominant one, though that certainly does not preclude increasing global demand as a factor. At the very least, as I mentioned in a recent post, I think this means deflation is dead. (The one-month drop in the January Core CPI notwithstanding; the big increases in PPI inflation at the crude and intermediate levels are pretty impressive, and a portent that inflation pressures will eventually make it to the consumer level.)

If deflation is dead and inflation is alive and well, as this chart suggests, then the downside risks to the economy are much less scary than conventional wisdom holds. It's my sense that there are a lot of people—including Bernanke and other Fed governors—who are very worried about the possibility of Japanese-style deflation and weak economic growth plaguing the U.S. economy for years to come. Those concerns are built on Phillips Curve thinking, which holds that when an economy is operating at a level significantly below its potential, then there are persistent downward pressures on overall prices. Downward price pressure—deflation—in turn saps consumer demand, or so the thinking goes, because consumers can make money by simply not spending it.

These concerns fail to account for the fact that the monetary fundamentals in Japan and the U.S. are completely different, and offer a better explanation of why deflation has been a persistent problem for the Japanese. The Bank of Japan has been pursuing a deflationary monetary policy for decades, as reflected in the fact that the yen has been appreciating against most currencies for the past 40 years, whereas the dollar is close to all-time lows against a basket of currencies. Moreover, U.S. demographics ensure healthy population growth for the foreseeable future, whereas Japan is now experiencing a shrinking workforce and a rapidly aging population.

To be sure, inflation is not a friend to economic growth. Inflationary psychology diverts much of the economy's energy to price speculation, rather than to jobs-creating investment. Plus, too much inflation inevitably leads to economic weakness, especially when central banks are forced to tighten monetary policy to bring inflation down.

But in the current environment I think it is the absence of deflation risk that is the important thing to focus on. If you truncate the deflationary side of an expected distribution of returns, you boost expected returns significantly. The disappearance of deflationary risk means the Fed will be less likely to be too easy for too long. The greater likelihood of inflation means consumers are less likely to continue hoarding money; money velocity is thus likely to increase, and this will help drive growth going forward.

It's very unfortunate that we have to be worrying about these issues in the first place. It would be far better to have had a stable monetary policy and stable (and low) inflation expectations over the past few decades. But we, like the Fed, are stuck with the consequences of past monetary actions and errors, and we need to deal with them. The situation we are faced with today is not one of deflationary risk, and it's important to understand that.

Confidence is weak, but so what?


Consumer confidence, according to the Conference Board's survey, unexpectedly fell this month (it was expected to hold steady, according to Bloomberg's survey), and this news today helped push the stock market down and the bond market higher. I have never paid much attention to confidence indicators, since they are reliably lagging indicators of what is going on in the economy. As this chart shows, confidence typically declines well after the end of recessions, and usually hits  new highs just before recessions begin. If anything, this chart is a great contrary indicator, and today's news should be taken as bullish. Consumers are usually the last ones to realize the economy is doing better.

For comparison purposes, the next chart shows confidence data as put together by the University of Michigan. Although their survey also declined in February, it was a very modest decline, and the trajectory of the index since the end of this recession has been noticeably stronger than the Conference Board's.


In any event, it's difficult to imagine consumer confidence improving significantly between now and the November elections, mainly because unemployment is likely to continue to be unusually high. There will be lots of talk this year about how this is another one of those "jobless recoveries." This in turn will predictably lead to more calls for another "stimulus" bill or "jobs package." That of course is exactly what we don't need. In my view, one of the main reasons this recovery has been unimpressive to date is the massive amount of stimulus spending that was approved last year. Most of the "spending" authorized by those bills was in the form of transfer payments, and those do little or nothing to create jobs or growth. What we are left with is more government interference in the economy, and a much higher debt burden. This in turn creates expectations of much higher tax burdens, and that stifles the incentives to take risk and create real jobs.


But even though confidence is low, it can improve slowly, as can the economy. We don't need new jobs to have a stronger economy, since the existing workforce can work harder and more efficiently, as indeed it has over the past year—nonfarm worker productivity rose an impressive 5% in the nine months ended last December. Over time, productivity tends to be about 2% per year; add this to a meager 1% growth in jobs (which is not enough to bring the unemployment rate down, since the workforce tends to grow about 1% a year) and you get economic growth of 3%. I've been saying we are likely to see growth of 3-4% this year; that's above the market consensus, but it is still consistent with only a very modest decline in the unemployment rate, and continued low readings of consumer confidence.

Home price stability returns


The Case Shiller index of home prices in 20 major metropolitan areas (seasonally adjusted) has risen seven months in a row. Given the lags built into the way the index is calculated, this means that the bottom in U.S. home prices likely occurred last February or March, almost one year ago. In real terms, as shown in this chart, home prices haven't changed much at all since the end of 2008. Thus, stability has returned to a market that suffered from extraordinary volatile for many years. The popping of the housing bubble resulted in an almost catastrophic 35% decline in real home prices, which in turn caused trillions of dollars of mortgage- and asset-backed securities to evaporate, threatening the viability of the entire world's banking system.

Fortunately, the dust is continuing to settle, markets are clearing, and life goes on. The stabilization of home prices has allowed the prices of securities such as shown in the chart below to rise for the better part of the past year. That's because the panic which set in over a year ago caused such selling pressure that the prices of asset-backed securities fell to levels that implied a continuing decline in home prices that was way too pessimistic.

Monday, February 22, 2010

Thoughts on government redistributionist schemes

"If someone gets something for nothing, then someone else must be doing something and getting nothing in return."

"If you rob Peter to pay Paul, Peter will eventually stop working."

"Government has little or no ability to create anything, but it can move wealth around and discourage its production."

HT: Russell Redenbaugh

Commercial real estate update: signs of a bottom


According to December '09 data released today by Moody's, commercial real estate prices in the U.S. are up 5% from their October lows. They are still down by a whopping 41% from their late 2007 highs, however, which is much worse than the 30% decline in nationwide housing prices according to the Case Shiller data. Nevertheless, I take this as preliminary evidence that we have seen the bottom in commercial real estate prices. (The bottom in residential real estate prices still seems to have been in the March-April '09 time frame.)

Combining the news on real estate prices with the prices of commercial real estate-backed mortgage securities in the chart below—prices have been rising for much of the past year—gives the same conclusion: as far as the market is concerned, we have seen the worst of the news from the commercial real estate sector, and we have probably seen the bottom in prices.

This stands in sharp contrast, of course, to the steady drumbeat of bad news from the commercial real estate sector, and the expected increase in default rates on commercial real estate loans. Hard as it may be to understand, I think this is just one more example of how the market anticipates events. Even though actual default rates are likely to rise in the coming months, the market today is telling us that the default rates we are likely to see are going to be less than what the market had expected and feared some months ago. The reality is going to be bad, indeed, but it is not going to be as bad as many had feared. All of the bad news has already been priced in. This is good news.

Bank credit update


This chart shows Total Bank Credit as measured by the Federal Reserve, a measure which focuses on lending to small businesses. Banks have been lending less (about $650 billion less, or 6.8% less than the high water mark) since the start of the financial panic in October 2008, and I'm sure everyone has heard that it is very difficult if not impossible for small businesses to get credit these days. The reasons for this are several: banks have tightened lending standards, not being eager to lend more in an uncertain economic environment; demand for loans has declined on balance, as lots of people and businesses have made a conscious effort to deleverage and otherwise clean up their balance sheets; and loan covenants have forced many borrowers to deleverage given the decline in the value of assets collateralizing their loans.

This chart suggests that there is another story that is playing out as well. Banks had gone on a lending spree in the years leading up to 2008, creating a lending or credit bubble of sorts, and the decline in lending since then is having the effect of bringing bank credit back into line with the size of the economy.

(Note that the 7% trend line on the chart reflects the annual average rate of bank lending growth from 1984 through the present. The average annual growth rate of nominal GDP over this same period was 5.7%, so even 7% annual growth represents an expansion of bank credit that is more than enough to accommodate growth in the economy.)

I would argue from these facts that, despite the recent decline in bank lending, there is no shortage of money in the economy (a theme I talked about frequently in the latter part of 2008). There has been some rationing of credit to some sectors which has been painful, but overall the economy has plenty of liquidity and plenty of credit. I suspect that given time and given more improvement in the economy, we will see banks once again expanding credit to those sectors most in need of credit. It's already the case that lending to large, well-established corporations has grown at a very impressive 13% annual pace since the end of 2008, according to the growth in the face value of the Merrill Lynch Corporate Master Index. Paradoxically, it's much easier for big companies to borrow hundreds of millions than it is for small companies to borrow millions. I doubt that banks will continue to forego the opportunity to profit from lending to small companies for much longer.

Friday, February 19, 2010

What a difference a year makes


More and more it becomes clear that the big collapse in 2008 was an aberration that resulted primarily from a severe shock to confidence and a huge and sudden increase in the world's demand for safety and liquidity, all triggered by fears of a collapse of the global financial system. Central banks were slow to respond to the unprecedented increase in the world's demand for money, and this resulted in a widespread selloff of all risk assets and massive deleveraging. Central banks eventually figured things out, and the return of liquidity has allowed prices of risk assets to recoup most of their losses. The collapse in monetary velocity which precipitated the recession has begun to reverse, and most economies around the world are again growing. The recovery is still in its early stages, however, and so there appears to be lots more room to the upside.

There have actually been two dramas playing out over the past year or so. One was the mechanical one that resulted from the shock to confidence and the huge increase in the demand for liquidity and safety. The other was the shock to long-term expectations that resulted from Obama's radical pursuit of a hard-left agenda that left investors struggling to comprehend the ramifications of a massive increase in government control over the economy and one new spending program after another. The expected burden of taxes began to soar; the anticipated efficiency and potential growth rate of the economy began to plunge; and the future solvency of the US government began to dissolve. The worst part of both dramas combined in a Perfect Storm to produce the equity market collapse of early March 2009.

Since then the economy has managed to heal many of its wounds, and the political scene has changed dramatically. We are now eight months into a recovery, and Obama's two signature initiatives, cap and trade and healthcare reform, are in a shambles. The Democratic Party appears to be completely out of touch with the mood of the electorate, which was never prepared for a hard turn to the left. The balance of power in Washington has shifted dramatically, and investor and consumer confidence is returning. (Whatever is bad for Washington is often good for individual liberty and free markets.)

One year ago we were asking ourselves how the economy could ever survive. Markets were braced for a future worse than the Depression, and years of global deflation were a virtual certainty. Stocks and corporate bonds were priced for Armageddon.

Today we are asking ourselves whether the economy will grow by 2% per year or by 4% per year. Whether the Republicans will regain control of Congress or not (with the best and most likely outcome being gridlock). Whether the Fed will begin raising rates before mid-year or by year-end. Whether small caps will outperform large caps or not. Whether inflation will be 2% or 5% per year going forward. Whether the Bush tax cuts will be extended or not. One year ago such questions would have been almost unthinkable—that's how far we've come in just one year.

I don't see a reason to think that the megatrends of the past year will reverse anytime soon. Things were unimaginably bad one year ago, but now there are plenty of reasons to be optimistic.

Thursday, February 18, 2010

Risk aversion is receding


I mentioned earlier this month that the rise in 3-mo. T-bill rates was something to keep an eye on. Rates have now gone from essentially zero to 11 basis points. That's not huge, but on the margin it reflects a decline in the market's risk aversion and/or desire for safety. Rates jumped today across the yield curve, as signs of recovery continue to trump fears of another recession. The Fed also announced a rise in the discount rate to 0.75%. That's not actually a tightening, but it is a step in the direction of slowly returning to normal.

Once more I will note that higher interest rates are not bad news for the economy. The Fed is not tight, and no matter what, monetary policy will not be tight for a very long time. Higher interest rates on Treasuries are best viewed as excellent signs that the economy is getting better.

The untold story behind today's unemployment


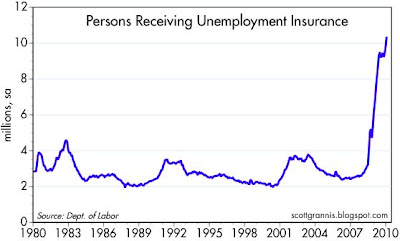
Everyone understands the need for unemployment insurance. You get fired because things go badly for your company, and suddenly you're on your own. It takes awhile to get back on your feet and find a job, especially if the economy is in a recession. That's why we have government- and employer-sponsored insurance programs that pay unemployment compensation for up to six months to those who lose their jobs through no fault of their own.

Occasionally, Congress will decide that economic conditions are so adverse that an extension of these benefits is called for. The most recent extension was called the Emergency Unemployment Compensation (EUC) program, and it started in July 2008. It was also by far the most generous in its eligibility requirements, effectively covering workers who became unemployed as early as May 2006. The chart above shows the number of persons receiving EUC in red, the number receiving regular unemployment compensation in blue, and the total in green. The EUC program has been extremely successful at recruiting recipients, since it has gone from zero to over 5 million in just 18 months and continues to expand, even as the number of those losing their job each week has fallen by 30% since last March.

In mid-2007, well before the recent recession began, the unemployment rate was a mere 4.4%. Out of a workforce (those working plus those looking for work) of 154 million, some 6.8 million were out of a job, and about 2.5 million were receiving unemployment insurance. Today, the workforce has shrunk to 153 million (discouraged workers have stopped working, others have decided to call it quits and retire), 14.8 million are out of a job, and 11.5 million are receiving unemployment insurance.

To put these numbers in historical and proportional perspective, I offer the next two charts.


The number and proportion of persons receiving unemployment insurance today is far greater than anything we've seen before. Even though this recession's highest unemployment rate of 10.1% was lower than the highest unemployment rate (10.8%) of the 1981-82 recession, the portion of the workforce receiving unemployment compensation today is 63% higher than it was at the peak of the 1982 recession. Fully 78% of those looking for a job today are receiving unemployment insurance, compared to only 38% at the height of the 81-82 recession.

Never before have we seen anything even close to today's largesse and compassion for those without a job. While not wanting to argue whether this is right or wrong, I would however argue that the aggregate desire of the unemployed to find a job today is undoubtedly much less than it was during the depths of the 81-82 recession.

And so we have here one more reason why this recovery is proceeding more slowly and painfully than we all would like to see. Not only are employers reluctant to hire because of all the legislative, political, and tax uncertainty out there, but the incentive for workers to seek out the jobs on offer is weaker than ever, especially for those jobs that don't come equipped with salaries exceeding their current exceptional benefits. Congressional compassion has its costs, and they are not just measured in terms of expenditures, but also in a slower recovery.

The Fed is behind the tightening curve


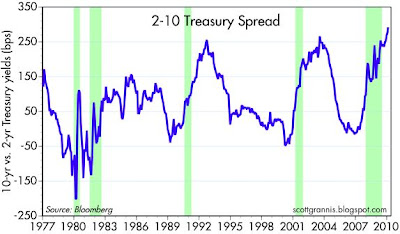
These two charts focus on the yield on 2- and 10-year Treasury yields from 1977 through today. The top chart shows the yields, while the bottom chart shows the difference in the yields, which is a measure of the steepness of the yield curve. If you compare the two charts, you will see that a steep yield curve generally corresponds to periods in which short-term rates are low, and that in turn is generally a sign of easy monetary policy. Steep curves typically flatten as short-term rates rise relative to, and more than, long-term rates. When the yield curve is inverted, short-term rates are higher than long-term rates; this is generally caused by very tight monetary policy, and this is what has preceded every post-war recession.

Today the yield curve is steeper than at any other time in history. This is the bond market's way of saying that short-term rates are exceedingly low, so low that they will have to rise by a LOT in coming years. The Fed has been keeping rates artificially low for quite some time now, and they will have to correct for this by raising rates by a lot in the future. The only thing we don't know is when they will begin raising rates.

This last chart shows the market's current expectations of what the Treasury curve will look like 1, 2, and 5 years from now. The bottom line is the current Treasury yield curve. I note that the market expects all Treasury yields to be significantly higher in 5 years than they are now. Note also that the market expects the curve to be slightly inverted 5 years from now, which further suggests that there is very little risk of recession for the next 5 years.

Deflation: RIP


The January Producer Price Index data released today should put finis to any notion that deflation is a risk. The headline number is up 5% over the past 12 months, and it has risen at a 9.8% annualized rate in just the past six months. Much of this perkiness is due to rising energy prices, of course, since the Core PPI is up only 1% in the past 12 months.

But before you say, "since core inflation is still well under control, there's nothing to worry about," let me make some important points.

The second chart is the PPI index plotted on a logarithmic scale. The white trend line shows that the PPI grew at a 1.2% annual rate from the early 1990s through 2002; this was a period during which monetary policy was generally tight, and by the Fed's own admission. Not surprisingly for us monetarists, inflation by all measures was well-behaved. Monetary was so tight, in fact, that gold and commodity prices fell from 1997 through 2002, and the dollar soared. Indeed, lots of people worried about deflation in the 2000-2003 period because money had been so tight in the years prior.

Since 2003, however, which is when the Fed decided that monetary policy needed to be kept very easy for a very long time in order to avoid the risk of deflation, inflation by all measures has picked up. The red trend line shows that the PPI grew at a 3.3% annual rate from mid-2003 through mid-2009. And as I mentioned above, the PPI has grown at almost a 10% rate in the past six months. Since 2003, gold and commodity prices have soared, and the dollar has collapsed, further confirming that monetary policy has been quite easy for the past seven years.

If monetary policy were tight enough to prevent inflation from exceeding, say, 1-2%, that would not necessarily preclude a huge rise in oil prices. But it would mean that if oil prices rose a lot, then there would be a lot of downward pressure on other, non-energy prices, since on average prices could only rise 1 or 2% a year. That's not the case currently, however. Although core PPI inflation has moderated somewhat since 2008, it is still positive and it has grown at a 3.3% annual rate in the past three months. My point is that if money were tight, then a big rise in energy prices should have produced at least flat, if not falling non-energy prices. But it hasn't.

Bottom line: monetary policy is loose, and it shows. Deflation is not even remotely a threat, despite the huge "slack" in the economy (the amount by which the economy is growing below its potential). The Fed has been running monetary policy based on a flawed theory of inflation. Price pressures are significantly higher than the Fed's model would suggest. They are making a mistake, and they need to get on the tightening bandwagon sooner rather than later.

This same analysis should also tell the economic recovery skeptics that they have been too pessimistic. If deflation is no longer even remotely a threat, then the downside risks to the economy are greatly reduced. Plus, even if the Fed were to start raising rates tomorrow, they are already behind the curve. It would take a LOT of rate hikes for a long time before monetary policy could be considered a threat to economic growth. It makes more sense to worry about inflation than it does to worry about the economy these days.

Wednesday, February 17, 2010

Federal budget update


This chart includes the January data released today. Revenues continue to decline, falling to just under 14% of GDP, a level not seen since the early 1940s. Expenditures (both on a rolling 12-month basis) have also declined in recent months, but that mainly reflects the running off of the intense spending associated with bailouts a year ago. Despite the recent declines, spending over the 12 months ended January was about 24% of GDP, a level not seen since World War II.

The deficit over the past year was $1.46 trillion, about 10% of GDP. There have been several industrialized countries that have lived with and survived deficits this large (e.g., Italy and Japan), but that doesn't mean that a deficit of this magnitude is OK. Indeed, I can't think of any country that has enjoyed healthy growth with such a large deficit. The deficit we have now—far from being stimulative as Obama keeps insisting—acts as a big drag on the economy, mainly because it comes entirely from a surfeit of spending and an orgy of expanding government programs and mandates. When government controls so much of our national income it can only do so much less efficiently than the private sector can. Also, with our extremely progressive tax system that calls on the top 10% of income earners to shoulder over 70% of the income tax burden, the incentives to work, invest, and take risk become very distorted.

One of the often-overlooked problems (call them unintended consequences) that come with a very progressive tax system that—like ours does now—relies heavily on things like tax rebates, earned income tax credits, and direct subsidies to lower-income workers, is that it inevitably leads to extremely high marginal tax rates at levels of income that affect a good portion of the middle and lower-middle class. (See my earlier post on this subject.) This means that a person who tries to raise his standard of living may end up paying a marginal rate of 80% on every additional dollar he makes, because at higher income levels he loses his subsidies and rebates. Why work twice as hard if you can only end up with 10 or 20% more? While appearing to help the poor and disadvantaged, it ends up trapping many of them near the bottom rungs of the income ladder.

It would be far better if our tax system relied on a relatively low, flat tax with few or no deductions.

A new conservative credo

Today saw the release of The Mount Vernon Statement, a relatively small collection of ideas and beliefs that have been embraced by a wide variety of conservative leaders. I think it's something that most Tea Party followers would be comfortable with. Perhaps most importantly to me—being a libertarian who reluctantly votes Republican—the statement is essentially devoid of any references to social issues, concentrating instead on the need for smaller government and individual liberty. It's a little vague for my tastes, but it's a nice way to begin to focus a much-needed debate. Highlights:

We recommit ourselves to the ideas of the American Founding.  Through the Constitution, the Founders created an enduring framework of limited government based on the rule of law.

[The Declaration] defends life, liberty and the pursuit of happiness. It traces authority to the consent of the governed. It recognizes man’s self-interest but also his capacity for virtue.

It reminds economic conservatives that morality is essential to limited government, social conservatives that unlimited government is a threat to moral self-government, and national security conservatives that energetic but responsible government is the key to America’s safety and leadership role in the world.

It applies the principle of limited government based on the rule of law to every proposal.

It honors the central place of individual liberty in American politics and life.

It encourages free enterprise, the individual entrepreneur, and economic reforms grounded in market solutions.

It supports America’s national interest in advancing freedom and opposing tyranny in the world and prudently considers what we can and should do to that end. 

HT: Glenn Reynolds

Europe lags the rebound in U.S. and Asia-Pacific


This chart makes it easy to see how Europe has been the laggard in the global recovery from the Panic Collapse of 2008. This continues a long tradition in which the European economies prove to be less volatile but also chronically less dynamic than those of the U.S. and the Asia-Pacific region. Big Government is one big reason for this; a case in point would be that since European companies find it much harder to fire people, they are also much less likely to hire them in the first place, thus explaining why German and French unemployment rates have been generally much higher than in the U.S.

In any event, U.S. industrial production has been rising now for seven straight months, at an annualized rate of about 10%. That counts as at least a moderate V-shaped recovery, as there's a whole lot of improvement still needed just to get back to where we were in early 2008.

Housing starts continue to improve


The residential construction industry suffered its sharpest and severest decline in recorded history beginning in 2006. Housing starts fell for three straight years, by over 75%. Residential construction fell, relative to the growth of GDP, by 60%, to its lowest level ever. If we had an overhang of houses back in 2005, that overhang has surely shrunk massively.

This recovery is as much about inventories as about anything. Housing inventories were exceedingly bloated back in 2005-2006, but they have now had years to get worked off. Inventories of just about everything else began to accumulate rapidly in late 2008 as global demand went into hiding, but now they are no longer falling and will soon need to be rebuilt. Housing construction is already up over 20% from last year's lows, and a slow recovery is quite likely to continue for the foreseeable future, especially since new household formations greatly exceed the current pace of new building activity. We're not talking about rebuilding inventories of housing yet, we're just talking about starting to keep up with demand so that inventories don't decline even further. None of this is very heroic, it's just the way business cycles work. To derail this process would be quite difficult.

So even though the upturn in housing starts looks pretty timid on this chart (nowhere near the status of a V-shaped recovery), it is part of a larger process that is quite significant. It pays to stay optimistic.

Too much hoopla over foreigners' holdings of US debt

The news of "a record drop in foreign holdings of U.S. Treasury bills in December" is not necessarily as bad as people are trying to make it.

China can't necessarily harm the U.S. economy by dumping a ton of its holdings of US Treasuries. If China continues to generate a trade surplus with us, but decides to a) sell some of its Treasury holdings and b) devote more of its dollar surplus to the purchase of debt from other countries, this does not guarantee at all that the U.S. economy will suffer. The most likely outcome of such actions would be to increase China's purchases of U.S. goods and services.

This is the key thing to remember: when country A sells more stuff to us than we purchase from them, then it ends up with dollars that can only be spent, ultimately, on something here in the U.S. The dollars that we spend on foreign imports never really leave the U.S. banking system, they simply change hands. Dollars are always spent here. A country that has a trade surplus with us must spend its dollars on a) our bonds, b) our stocks, c) our real estate, or d) deposit those dollars in a US bank account. Dollars that figuratively travel overseas to buy foreign goods are always recycled back to the U.S. economy in some form or other.

If the rest of the world decides tomorrow that they are all fed up with financing our profligate spending ways, then there is really only one thing that will obviously have to happen: if all the countries that have trade surpluses with us decide to stop buying Treasuries, then they will have to spend the dollars they earn from selling things to the U.S. on something else here in the U.S., or deposit those dollars in a bank account here. A big decline in Treasury purchases on the part of the rest of the world would most likely mean, therefore, a big increase in U.S. exports of goods and services. Higher interest rates on our bonds would coincide with a big increase in our exports. Is that a bad thing? I don't know, because the answer is not obvious to me. (Though I still think that higher interest rates would be a good thing, because they would signal a stronger economy.)

There are other considerations as well. It's not obviously in China's interest to dump tens or hundreds of billions of Treasuires, because that might depress the dollar and thus destroy the value of the trillions of U.S. assets it already holds. China is really between a rock and a hard place on this issue.

Tuesday, February 16, 2010

The risk trade comes back


This is a Bloomberg index of real-time commodity prices. Commodities have bounced nicely in the past 10 days. The dollar is no longer rising and may be turning down. Gold prices are up. Oil is up. Equities are up. The "risk trade" is back, mainly—I think—because the signs of improving economic activity continue to trump the market's fears. A recovery like we have underway is not something that is easily derailed. Yes, policies remain awful, but that's been the case for the past year. On the margin the outlook for policy has improved, and that is what's important.

I note today the news that a Rhode Island town decided to fire all of its unionized teachers after they refused to work 25 minutes more. This probably marks the tipping point for public sector workers' compensation packages all over the country. The fact that public sector workers have great job security and make a lot more than their private sector counterparts just doesn't make sense. I won't be surprised to see many more towns and states imposing pay cuts and layoffs on their public sector workforce. This is a good thing for the economy (though of course painful for those affected). It better happen here in California.

NY manufacturing is healthy


This chart shows the NY Fed's index of manufacturing conditions in the state of New York. Sure looks like another one of those V-shaped signs of recovery, doesn't it?

Monday, February 15, 2010

The global warming crowd is in big trouble (2)

The Global Warming agenda continues to disintegrate, having passed an "extremely important inflection point" as I noted last November. The news just keeps getting worse. They don't have the data. They were making things up. The computer models were fudged and tinkered with. There has been no warming since 1995. The Medieval Warming Period, way before mankind started blowing carbon into the atmosphere, was likely much warmer than the current period. Governments are slowly coming to the conclusion that heroic attempts to alter their economies in the name of saving the planet don't make sense if there is no science to guide them.

This is good news for the economy because it greatly reduces the threat of punitive legislation that would force us to use more expensive energy sources. It is also good news because it contributes to the growing sense, felt acutely by those of Tea Party persuasion, that government has gone to far in regulating, taxing, and otherwise controlling our lives. It takes big things like this to move the public by enough to achieve transformative change in our politics. Have you noticed the growing list of long-time senators and congressman who are deciding to retire (Evan Bayh being the latest).

The political winds are shifting because the electorate is fed up with big government and all of its intrusions into our lives. The realization that this was coming helped propel the market higher beginning last March, and I believe there is still a lot more upside potential as the new reality of shrinking government begins to take shape. I can't think of anything right now that is more significant for the future of the economy than this emerging change in the mood of the electorate. The retreat of Climate Change is a small but important part of a larger movement that believes that Big Government promised way too much all along and has failed miserably to deliver.

Friday, February 12, 2010

Consumer confidence slowly returns


Consumer confidence has risen meaningfully from the depths of depression that prevailed in late 2008. But there is still a long way to go to get back to normal. Confidence is an important part of this recovery, because the financial panic that drove the recession also caused a major decline in money velocity. As confidence slowly returns, money velocity is beginning to rise (and money demand is beginning to fall); the money that was hoarded in the recession is beginning to be spent again. Rising confidence and rising money velocity are thus important drivers of this recovery. We're making progress, but slowly.

Retail sales: a V-shaped, but sub-par recovery


Retail sales grew at a 7.9% annualized pace in the six months ending January. That's a pretty nice recovery. However, as the second chart shows, although sales are increasing at an above-trend pace, they are still about 12-13% below the levels that would have prevailed in the absence of a deep recession. We see the same pattern in GDP, which is about 9-10% below its trend. The gaps in both of these cases are substantial, but they are narrowing. In previous deep recessions, this gap narrowed quickly, thanks to very strong growth. This time it's likely to narrow more slowly, thanks to the huge increase in the size of government and income redistribution programs and the threat of higher tax rates in the future.

If Obama were really the "fierce advocate of free markets" that he says he is, he would have done things very differently last year. Instead of counting on massive income redistribution and big increases in government spending, he would have trusted free markets to pull the economy out of recession, and lowered marginal tax rates on income, capital, and corporate profits to get things jump-started. The deficit would have been much lower, and the economy much stronger. We're at a level of deficits now that are so high they are soaking up a major portion of the world's savings. If government weren't borrowing so much, the world's savings would be used by the private sector in a much more efficient and productive manner.

Thursday, February 11, 2010

It's VERY different this time


It seems I keep running across people's attempts to compare today with the Depression of the 1930s. But as I was going through and updating my charts, I ran across this one of the yield on 10-year Treasury bonds. Bond yields (the 10-year was the longest Treasury maturity available until the mid-1970s) first hit 2.0% in 1941, well after the worst of the Depression and Deflation of the 1930s, and it took until late 1958 before yields rose to the level they are trading at today. In other words, it took the U.S. economy 25 years following the Depression—the low point of the Depression occurred in 1933—to get interest rates up to where they are today. Today the bond market has only taken a little over 13 months (from the end of Dec. '08, when markets were priced to a Depression) to move yields up from 2% to today's 3.7%.

Clearly, there's no comparison between the past year or so and the Depression of the 1930s. In the old days they made Depressions that lasted a long, long time. Nowadays they're over before they even get a chance to start.

If there's anyone we have to thank for short-circuiting this recent depression, it's the Fed. It's amazing how fast a trillion dollars of new money can put an end to the threat of deflation.

Wednesday, February 10, 2010

The 10-yr Treasury signal

This chart should not be interpreted scientifically. It is my interpretation of what the yield on 10-year Treasury bonds reveals about the market's outlook for U.S. economic growth. It's subjective, but I think it fits with a lot of the evidence that I follow. Today it's saying that the market believes the U.S. economy is growing at a relatively unimpressive pace; the consensus of most forecasters seems to be somewhere around 2-2.5%. If yields move above 4% this will be a good sign that optimism is returning. At 5%, the bond market would be telling us that we're in for a decent recovery, which would imply growth of 4% or more. I expect to see yields moving up to at least 4.5% this year, which would be consistent with growth expectations of 3-4%.

China's imports surge


We all know that China is a prolific exporter of cheap, quality goods to the rest of the world. Given the recent recovery in the U.S. and other developed countries, I was not surprised to read last night that China's January '10 exports rose 21% from what they were in Jan. '09. But what really surprised me was to see that China's Jan. '10 imports had soared by 85% from a year ago. This may be distorted a little on the high side by the timing of the Chinese New Year, but there is no denying, as this chart shows (not seasonally adjusted), that the Chinese have been doing their best to spend as much of their export earnings as possible. In fact, China's trade surplus (the thing that they are accused of aggravating by keeping the yuan "artificially low" against the dollar) was lower last year than it was in 2007 and 2008.

Skeptics will argue that Chinese imports surged because they are mindlessly stockpiling all sorts of commodities, but I see this as a sign that one of the world's most dynamic economies has recovered rapidly from the same trade collapse shock that rocked the rest of the world. It's onward and upward from here.

Trade stages a V-shaped recovery


World trade collapsed spectacularly beginning in the summer of 2008, and it staged an impressive comeback in 2009. By the end of last year, U.S. exports of goods and services had recovered fully half of what they lost from July '08 through April '09. If this isn't a V-shaped recovery in trade—arguably the most important source of global economic growth—then I don't know what it is. The global economic engine is firing on all cylinders, and it's not going to stop anytime soon. In fact, there is still a lot of catching up to do to get back to where we were in mid-2008, which means more growth for everyone.

Tuesday, February 9, 2010

Copper update and other musings


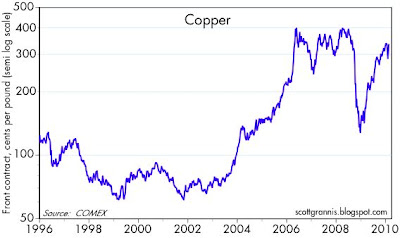
Early in January I posted a chart of copper prices with the title "Dr. Copper says the patient has recovered." I noted that the huge rebound in copper prices was a good sign that the global economy had recovered from its slump and was rapidly returning to health. Since then, copper prices have fallen about 15%, commodity prices in general have slumped, and so have equity prices.

The shorthand version for what has happened in the past month is a reversal of the "carry trade:" risk assets are down, and the dollar is up. Fear is up too, with the VIX bouncing from the teens to the mid-20s. Concerns over Greece and the stability of the EU are likely catalysts for the recent bout of nerves, but so too is the sudden rise of populist attacks on big banks (see my friend Don Luskin's article in today's WSJ on the subject), concerns that Fed and some other central banks are preparing to tighten monetary policy, and the fact that numerous countries, including the U.S., are being forced to confront the problem of out-of-control budget deficits brought on by profligate public sector spending practices.

Does this selloff in risk assets mark the end of the recovery and the beginning of a renewed bout of economic weakness? Could a Greek default really bring down the EU and/or the Euro, and ultimately infect the U.S. economy with another case of the economic willies? Is the global recovery so tenuous that it can't bear interest rates that move up from zero, or that it can't survive without government spending life support?

My position for the past year or so has been that the U.S. economy has recovered in spite of all the fiscal and monetary stimulus that has been thrown at it; that in fact the recovery would be stronger if it weren't for stimulus. I think fiscal and monetary stimulus are vastly over-rated. No one can prove what the government spending multiplier is, but I'll vote for it being negative. I don't see how the act of taking money from John and giving it to Joe can result in a stronger economy, and if Joe ends up being less careful about spending the money he's been given than John (which is not a very dubious proposition), then the result is clearly a weaker economy. And since when does printing money make an economy stronger? Throwing money out of helicopters probably results in new spending, but that is much more likely to just push prices up than it is to cause anyone to build new plant and equipment.

Consequently, I can't get concerned over the approach of the end of stimulus, which I think is the dominant source of the market's fear in recent weeks. Bring it on, I say. Let's have higher interest rates right now, so we can worry less about what how high inflation might go in the future. Let's have spending freezes or outright reductions in spending right now, so we can worry less about how high future tax burdens might have to rise. Let's please return to the old-fashioned notion that people know best and government knows least about how to run our lives and our businesses. Let's hope that the Tea Party ends up throwing a bunch of misguided politicians of both parties out of Congress come this November.

If lower copper prices and a reversal of the carry trade are signaling anything, it's that the world may be stumbling its way to a better set of policies, and that is good news.