Tuesday, July 30, 2013

The problem with Obama

... is that "he does not understand rudimentary economics," writes Richard Epstein in an excellent article titled "Obama's Middle Class Malaise." Here are some excerpts, but read the whole thing for a concise and sober explanation of what ails the U.S. economy from a policy perspective:

The President, who has never worked a day in the private sector, has no systematic view of the way in which businesses operate or economies grow. He never starts a discussion by asking how the basic laws of supply and demand operate, and shows no faith that markets are the best mechanism for bringing these two forces into equilibrium.
Unfortunately, our President rules out deregulation or lower taxes as a way to unleash productive forces in the country. Indeed, he is unable to grasp the simple point that the only engine of economic prosperity is an active market in which all parties benefit from voluntary exchange. Both taxes and regulation disrupt those exchanges, causing fewer exchanges to take place—and those which do occur have generated smaller gains than they should. The two-fold attraction of markets is that they foster better incentives for production as they lower administrative costs. Their comparative flexibility means that they have a capacity for self-correction that is lacking in a top-down regulatory framework that limits wages, prices, and the other conditions of voluntary exchange.
[Obama] constantly thinks of his greatest regulatory failures as his great successes. No other president has “saved the auto industry,” albeit by a corrupt bankruptcy process, or “taken on a broken health care system,” only to introduce a set of unworkable mandates that are already falling apart, or “investing in new technologies,” which tries to pick winners and ends up with losers like Solyndra. The great advances in energy have come from private developments, most notably fracking, and not from the vagaries of wind and solar energy, which no one has yet figured out how to store for future use when needed.
So long as the President is trapped in his intellectual wonderland that puts redistribution first and regards deregulation and lower taxation as off limits, we as a nation will be trapped in the uneasy recovery that will continue to dog us no matter who is chosen to head the Federal Reserve.

Housing prices firm


Both Case Shiller and Radar Logic report strong gains in housing prices a few months ago. Home prices are up about 10% year over year.


But price increases are slowing on the margin, as shown in the first chart above. The second chart above compares the Radar Logic house price series for 2011, 2012, and 2013. Note that this year, prices fell in late April and early May, when the usual seasonal pattern is for them to rise. No doubt the housing market has gotten a case of the same jitters that affected the bond market in recent months after the Fed began discussing an early end to its bond-buying. New mortgage applications for home purchases have dropped about 10% in the past few months.


As the chart above shows, 30-yr fixed rate mortgages have jumped almost 1 full point in recent months. I doubt this will kill the housing market, but it seems likely to put a damper on home buying enthusiasm for awhile.


Meanwhile, on an inflation-adjusted basis, prices today are about the same as they were back in 2009; the recent price increases have merely offset the impact of inflation in the past four years.

What we see here so far is more in the nature of a stabilization and consolidation of the housing market which will eventually lead to a stronger recovery over time.

Monday, July 29, 2013

Stocks track truck tonnage


It's not surprising: the inflation-adjusted value of U.S. equities has closely tracked the amount of tonnage carried by U.S. trucking services, according to data compiled by the American Trucking Association. Truck tonnage is a reasonable proxy for the size of the economy, so it makes sense that as the economy expands the value of U.S. businesses should rise. At times stocks appear to overshoot or undershoot truck tonnage, but that is likely due to the vagaries of human emotion which tend to magnify the ups and downs of the business cycle.

With truck tonnage up almost 6% in the year ending June 2013, the expansion of the U.S. economy may actually be greater than suggested by the GDP statistics, which, when released later this week, will probably show that the economy grew by about 2% over the same period. GDP growth statistics may be registering a bit on the low side due to the relatively dramatic shrinkage of the public sector during the past four years. Regardless, the ongoing physical expansion of the economy reflected in rising truck tonnage is encouraging.

The recovery is real; it is not a figment of Fed policy or the result of fiscal "pump-priming."

Newest tongue twister: "stocks track truck tonnage"

Credit spread update: still looking good

Credit spreads typically are good coincident and leading, market-based indicators of the health of the U.S. economy. Although they are still somewhat higher than they have been in the past—during times of normal growth and relatively tranquil conditions—they show almost no sign of concern and are consistent with an economic expansion that is ongoing.


Swap spreads—proxies for AA bank credit risk and highly liquid—have been the best leading indicators of trouble ahead. The chart above provides a long-term history of 2-yr swap spreads. (See here for a more detailed explanation of swap spreads.) Swap spreads have risen in advance of every recent recession, and have declined meaningfully in advance of every recent recovery. Currently they are about as low as they have ever been. This is symptomatic of very healthy liquidity conditions in U.S. financial markets, generally low default risk, accommodative monetary policy, and very low systemic risk.


The first of the above charts focuses on the past six years, and compares U.S. swap spreads to their Eurozone counterparts. Eurozone swap spreads are still somewhat elevated, but that is not surprising given the ongoing problems with sovereign default risk in the Eurozone. It is comforting to see that Eurozone swap spreads have been relatively stable for most of the past year. This has proven to be a good leading indicator of economic conditions in Europe, which are improving, as shown in the second chart (note that swap spreads are inverted, to show that declining spreads point to improving conditions); Eurozone manufacturing is pulling out of its two-year slump and the Eurozone economy may therefore soon be emerging from recession.


Credit default swap spreads are highly liquid, generic indicators of corporate default risk. They are now very close to post-recession lows, although still higher than their pre-recession lows. This suggests some ongoing concerns, but that is not surprising given that the U.S. economy is still mired in a disappointingly slow recovery. On the bright side, however, generally low and stable credit spreads show that the corporate sector is generally quite healthy.


As the above chart shows, swap spreads were good leading indicators of junk bond spreads before and during the recession. With swap spreads very low and stable, high yield spreads should at least be relatively stable and likely have room to fall further.


This last chart gives a long-term look at credit spreads for the investment grade and high-yield corporate bond sectors. Spreads are still relatively attractive compared to their historical lows, and they have been largely unaffected by the recent 100 bps rise in 10-yr Treasury yields. This is the bond market's way of saying that higher Treasury yields pose little or no threat to the economy.

Friday, July 26, 2013

Confidence slowly returns and that is huge


Consumer confidence is slowly returning. The University of Michigan measure of consumer confidence reached its highest post-recession level this month. Confidence remains relatively low from a long-term historical perspective, but there is little doubt now that confidence is increasing, and it's changes on the margin like this that are very important.


This has been the weakest recovery ever, and confidence has been extraordinarily low for most of the recovery. The world, in fact, has been very risk averse throughout this entire recovery. But things are changing. Gold was the beneficiary of investors' fears, rising to $1900, but now that confidence is making a comeback, gold has dropped to $1300. That's a big deal. Real yields on 5-yr TIPS fell to a low of -1.8%, as investors were willing to accept a decidedly negative real rate of return in exchange for protection from inflation and from potentially another collapse of the economy. Now, real yields have risen to -0.5%; that's a big deal too.


Risk aversion, a desire to rebuild and strengthen balance sheets, and the desire to deleverage led to a huge demand for money (e.g., the components of M2: currency, checking accounts, time deposits, and savings deposits). Never before has M2 been so high relative to national income. The bulk of the increase in M2 came in the form of bank savings deposits, which pay almost no interest at all: that is how intense the demand for money and safety has been.

But now that confidence is returning, it's reasonable to think that the world no longer wants to accumulate more and more cash and cash equivalents (i.e., money). The world may in fact soon attempt to reduce its money balances. Cash can't disappear, of course, but the desire to hold less cash can result in higher prices for other things and more economic activity (e.g., faster nominal GDP growth).

As confidence slowly returns, banks may become more willing to use their abundant supply of reserves to make more loans, and consumers and businesses may become more willing to seek out loans. Bank lending could accelerate, increasing the supply of money at the same time as the demand for money is declining. These are the ingredients for rising inflation, which up to now has been quiescent because the demand for money has been intense.

This has been the weakest recovery ever because the world has been exceedingly fearful of a lot of things. Those fears are slowly being replaced by confidence, and that means that we could be on the cusp of a sea change in the economic fundamentals, in favor of faster GDP growth and higher nominal prices (inflation). So far the only evidence of this is gold and TIPS prices and a modest rise in consumer confidence. But once this snowballs, the momentum and the magnitude of the change could become impressive. Will the Fed be able to react in a timely fashion and reverse QE in keeping with declining money demand? That could be the most important question of the next year or so.

Thursday, July 25, 2013

Still avoiding recession

As I said last January, avoiding recession is all that matters for investors. Cash and cash equivalents pay either nothing or next to nothing, while alternative investments yield much more. Cash yields are zero because the demand for money is extremely strong, and because risk aversion is very high. The Fed's QE program has been specifically designed to satisfy this extraordinary demand for money, as I explained last March. The world eschews much higher-yielding investments in favor of accumulating record levels of cash, because market participants are very afraid of an economic downturn that will reward the decision to hold cash.


Bank savings deposits have soared in the wake of the Great Recession, rising by almost $3 trillion. This is one of the clearest signs of just how risk averse the world is these days.

But holding cash has been a losing proposition because the economy hasn't deteriorated. We haven't seen much in the way of growth, but we certainly haven't seen anything even approaching a recession.


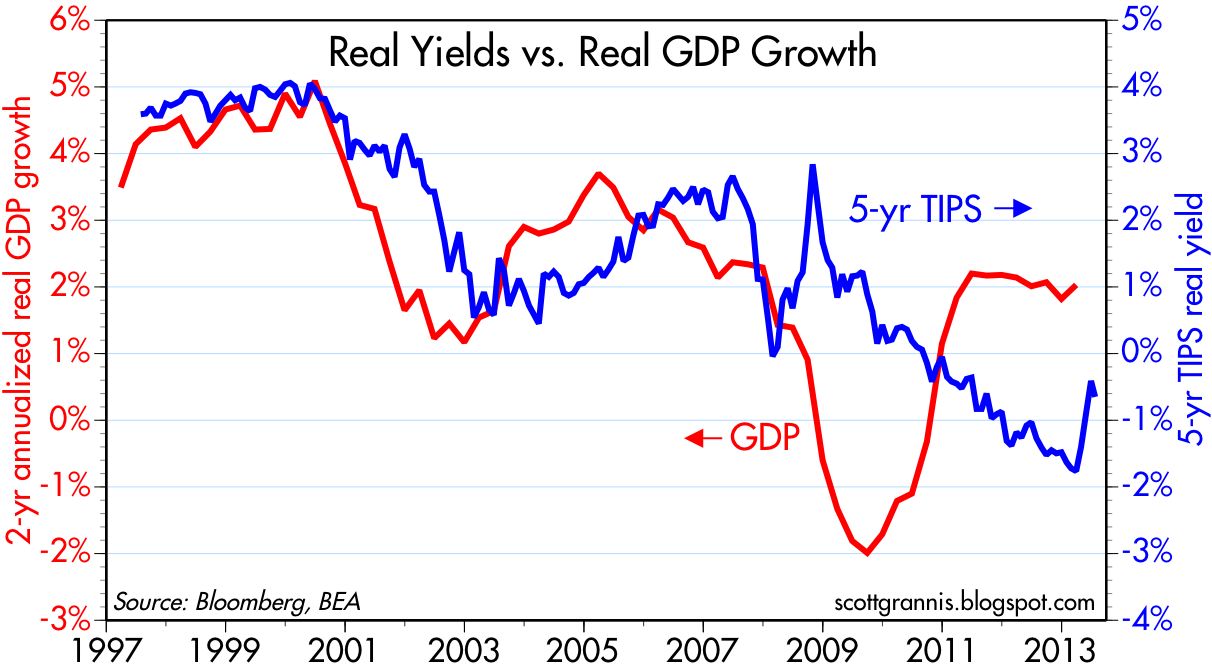
Holding cash has a very high opportunity cost these days, as the above chart demonstrates. So let's review some timely indicators that show how the economy continues to improve, how the risk of a recession remains very low, and why holding cash is a risky proposition.


Recessions are invariably preceded by a rise in weekly claims for unemployment. That's not the case today, as claims continue their downward trend.


Announced corporate layoffs remain very low. No sign here of any concerns on the part of corporate business. Corporate profits, meanwhile, are at all-time highs and improving.


The Eurozone has been mired in a recession for the past two years, but lately there are signs that conditions are improving. The Markit survey of Eurozone manufacturing purchasing managers in July registered over 50 for the first time in two years. The U.S. has been doing reasonably well despite the decline in the Eurozone economy; if the Eurozone is indeed now beginning to expand again that should be good news for U.S. exports and U.S. GDP. What's good for Europe is good for the world.


The housing market continues to show signs of a strong recovery. Housing starts remain abysmally low, but they have risen almost 40% in the past two years. It's the change on the margin, not the level, that matters the most to markets and to the economy.


Every recession in the past 50+ years has been preceded by a tightening of monetary policy. What's the best way to measure how tight monetary policy is? The real Fed funds rate, and the slope of the yield curve. Money is tight when real borrowing costs are high, and when the yield curve is flat or inverted. Currently, short-term borrowing costs are negative, and the yield curve is quite steep. This is the market's way of saying that the Fed is very accommodative now, but is expected to raise short-term interest rates in the future as accommodative policy becomes less necessary. Monetary conditions today are the exact opposite of what we usually see leading up to a recession.


Swap spreads have been very good leading and coincident indicators of systemic risk and the health of the economy. Currently, swap spreads are very low. This means that liquidity is abundant, and the default risk of major financial institutions is very low. It's a lack of liquidity that provokes recessions. Financial markets today are not picking up any signs of deterioration. Indeed, it's just the opposite: from this perspective the economy looks to be in good health and likely to improve rather than deteriorate.


Bloomberg's measure of financial conditions is about as strong as it has ever been, and this reinforces the message of swap spreads. The indicators which comprise this index are sensitive, market-based indicators of financial market health, and are usually very good at anticipating brewing trouble. Today these indicators are pointing up, not down.


The ISM manufacturing index has declined from its 2011 peak, but remains well above levels that in the past have been associated with recessions, as the chart above suggests. Expectations call for the July reading of the index to rise to 52, and that would be consistent with real economic growth of 2-3%, a slight pickup from the 2% growth we've been seeing in the past year or two.


Car sales have been extremely strong for the past four years. When car sales greatly exceed expectations this sends ripple effects all throughout the economy, resulting in stronger production and employment gains—a virtuous cycle.


The private sector has been posting 2% annual growth in employment for more than two years, and there is no sign that this is faltering. The only weak part of the employment picture in this recovery is public sector jobs, but as the second chart above shows, the shrinkage of the public sector workforce looks to be coming to an end. A smaller public sector is a good thing for the economy, since that gives the private sector—the only true source of prosperity—more breathing room.

So: financial markets are very healthy, monetary policy is accommodative, the housing market is getting back on its feet, car sales are booming, Europe is recovering, business investment is picking up, and jobs are growing. What's not to like?

Answer: cash.

Business investment picks up


June capital goods orders beat expectations (+0.7% vs. +0.6%), even after May orders were revised upward by over 1%. Orders are now up at a 19% annualized pace over the past six months, and up 7.1% over the past year. Orders had weakened noticeably last summer, as uncertainties over the "fiscal cliff" weighed on business confidence. That uncertainty was favorably resolved, and this measure of business investment is now at a new all-time high.

The broader durable goods orders (which includes volatile defense and aircraft orders) has also reached a new all-time high, and is now up almost 11% in the past year.

Capital goods orders are the seed corn of future productivity growth, and a good barometer of business confidence in the future, so today's news is encouraging. The private sector is now the economy's main engine of growth, which is as it should be.


Thanks to the unprecedented postwar decline in federal spending relative to GDP in recent years (see above chart), the government is getting out of the way and the private sector has more room to breathe. The economy still faces strong headwinds, in the form of higher marginal tax rates and heavy regulatory burdens, but it's hard to keep the private sector of the U.S. economy down if left to its own devices. In my experience, it never pays to underestimate the ability of the U.S. economy to overcome adversity.

Tuesday, July 23, 2013

Random charts and thoughts

Blogging has been light mainly because I haven't run across any new or interesting developments. We are still in a modest/moderate growth environment (about 2% per year) with relatively low inflation (about 1.5-2%). The Fed is gearing up for the end of QE, first by tapering its purchases, and later (late next year?) by raising the interest rate it pays on bank reserves. The market was initially spooked by the prospect of a QE unwinding, but now has put those fears to rest. There are no signs of any deterioration in the economy, and as long as the economy avoids recession, risk assets—which yield substantially more than risk-free cash and cash equivalents—are likely to rise in price.


If weekly unemployment claims are a good proxy for the health of the economy, then the chart above demonstrates that equity prices have risen in line with an improving economy. Lots of wiggles and mini-panics along the way, but the improving trend in both series remains intact.


The current PE of the stock market is very close to its long-term average, even though corporate profits are at near-record levels relative to GDP. Stocks may be fairly valued, but they are not overvalued by these measures.


The earnings yield on the S&P 500 is still above the yield on BAA corporate bonds. This shows that the equity market is still not very confident in the outlook for earnings, since it is willing to forego the appreciation potential of stocks and give up yield at the same time, in exchange for the relative security of bonds, which are senior in the capital structure.


The two biggest changes on the margin in financial markets in recent months have been the decline in gold prices and the rise in real yields (or, if you prefer, the decline in TIPS prices). Both have been tightly correlated for the past 6-7 years (see first chart above). Both TIPS and gold are classic inflation hedges, so their declining prices are symptomatic of declining concern over the outlook for inflation. But as the second chart shows, the recent decline in inflation expectations (the green line) is quite modest when viewed from an historical perspective.


As the chart above suggests, the big rise in real yields/decline in TIPS prices has a lot more to do with the market's outlook for real growth that it does with the market's inflation expectations. The very low level of real yields several months ago was symptomatic of a market that was quite pessimistic about the prospects for growth. Investors were willing to pay very high prices for gold and TIPS because they feared that very weak growth prospects raised the risk of losses in alternative assets. Gold and TIPS are "safe assets" that no longer command such a high premium because investors' fears, uncertainties, and doubts about the future have declined somewhat in recent months. This dovetails as well with recent modest rises in consumer confidence and increased bank lending.


Many worry that declining gold and TIPS prices signal and increasing risk of deflation. But as the chart above shows, it's more likely that gold has declined because it had previously risen by an extraordinary amount, far above the rise in other commodity prices. In the absence of any rise in the inflation rate, gold was going to have a very tough time remaining at such elevated levels. Gold is now in the process of realigning itself with commodity prices. Commodity prices are down from their 2011 peak, but they are still well above (130% above) their 2001 lows. This is all symptomatic of a market that not too long ago had very big concerns about weak growth and rising inflation—concerns that have now been somewhat assuaged. There's nothing here that would suggest deflation.


After a brief, QE-temper-induced uptick, credit spreads have settled back down to their lowest levels since the Great Recession. They are still substantially higher than they were during times of relative tranquility and strong growth (e.g., 1997 and the mid-2000s), but they do not reflect any deterioration in the economy's health, nor any great concerns. The market is now saying that an earlier-than-expected end to QE is not necessarily a bad thing for the economy. The economy will very likely not suffer if the Fed proceeds with a tapering of QE prior to the end of this year.


As the first of the above charts shows, the Vix index of implied equity volatility (a proxy for the market's degree of uncertainty) is relatively low, having declined in fits and starts from extremely high levels during the Great Recession. The market is much less uncertain these days. The second of the above charts shows the ratio of the Vix index to the 10-yr Treasury yield (a proxy for the market's confidence in the health of the economy). Like the Vix index, this ratio has also declined in fits and starts from extremely high levels. You might say that this chart is showing the while the market is less uncertain about what the future holds, it is still not very optimistic about the economy's ability to grow—10-yr yields are only 2.5%, and that is very low from an historical perspective, lower even than during the Depression.

So we are making progress, and the economy continues to grow, albeit at a disappointingly slow pace. Uncertainty is down, pessimism has receded, but enthusiasm is still in relatively short supply.

Thursday, July 18, 2013

Claims continue to decline


The above chart compares the unadjusted claims data from this year to the same dates last year. Claims in recent weeks are running about 10% below claims from the same date last year. June claims typically rise because of temporary retooling layoffs at auto plants.


The number of people receiving unemployment compensation is down 21% from the same time last year, a trend that has been in place for more than three years. As I've been saying repeatedly, this is one of the biggest and most positive changes on the margin in today's economy, since it involves changing the incentives of millions of people—encouraging them to find and accept a job offer. 


This chart shows the seasonally adjusted level of claims, which are down 10% from year-ago levels.

Claims data is timely and not subject to significant revisions, and so far there is no sign of any deterioration in the health of the economy or the jobs market. This has major implications for those who hold cash in anticipation of a deterioration in the economy. Given the almost zero yield on cash and the much higher yields available in alternative investments (see chart below), holding cash as a hedge against a weaker economy is an expensive proposition—and so far a losing one.


As long as the economy fails to deteriorate, the prices of risk assets are likely to continue to rise as the world attempts to reduce its (relatively large) holdings of cash in favor of higher-yielding investments.

Wednesday, July 17, 2013

Weak housing starts don't signal the end of the housing recovery


June housing starts were significantly below expectations (836K vs. 960K). Brian Wesbury argues that it was most likely due to weather: "18 states in the South and East had rain totals in June that ranked among their 10 wettest on record." He adds that "The vast majority of the decline (95%) was due to the very volatile multi-family sector." As the chart above shows, this series is notoriously volatile. With home builders' confidence up significantly, and with building permits in June (see chart below) running above starts (911K vs. 836K), it is reasonable to think that the recent decline in starts will reverse. In any event, it remains that case that starts are up over 10% in the past 12 months, and have they have surged 56% in the past three years.


It's possible that the recent rise in mortgage rates, which began in May, could be responsible for some of the decline in June starts. But it would be premature to conclude that the housing market recovery has come to an end—this is more likely just a pause.


New mortgage applications for home purchases have only declined marginally since mortgage rates started rising, suggesting that underlying demand for housing remains relatively strong.